Honors Algebra 2
This book contains sketches created for my Honors Algebra 2 class at Stuyvesant High School
Table of Contents
- Trigonometry
- Unit Circle Trigonometry
- Unit Circle: Complementary Angles
- Unit Circle: Sine and Cosine Functions
- Graph of Cosine
- Graphing Sine/Cosine with Translations
- Graphing the Tangent Function
- Lighthouse Function p.553 #69
- Cosine of the Difference of Two Angles
- The Ambiguous Case of SSA
- Complex Numbers
- Multiplying Complex Numbers
- Exponential and Logarithmic Functions
- Exponential graph as 2-variable function
- Conic Sections
- Locus Definition of a Parabola
- Statistics and Probability
- Tossing a fair coin n times
- Sample Means 1
Unit Circle Trigonometry
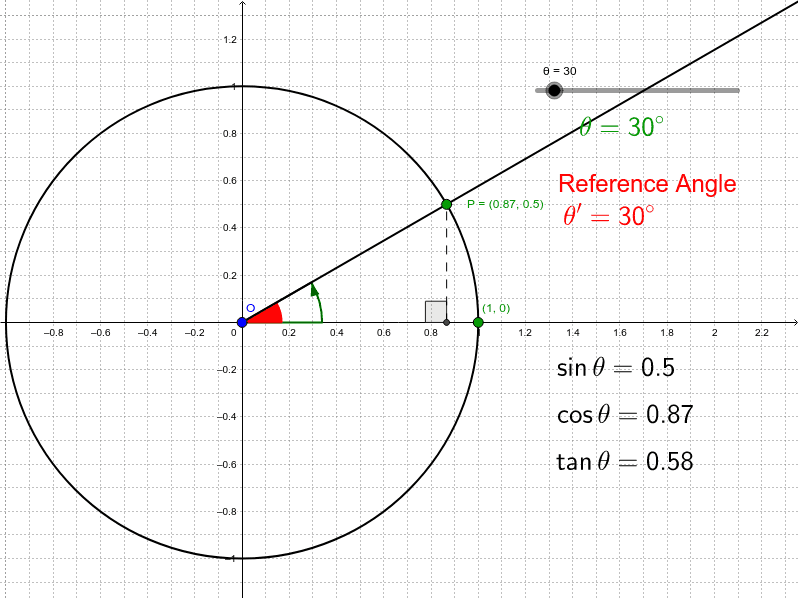
Drag the slider for [math]\theta[/math] to adjust the angle. Notice the coordinates of point [math]P[/math] on the unit circle.
Unit Circle Definition of Trig Functions
We can extend the definitions of sine, cosine and tangent (and their reciprocals) to angles of [i]any[/i] measure, by using the unit circle.[br][br]On the unit circle, if the point [math]P[/math] has coordinates [math]\left(x,y\right)[/math], then from the right triangle we can see that, in Quadrant I:[br][math]x=\cos\theta[/math][br][math]y=\sin\theta[/math][br][math]\frac{y}{x}=\tan\theta[/math][br][br]Therefore, the point where the terminal side of [math]\theta[/math] intersects the the unit circle will have coordinates [math]P\left(\cos\theta,\sin\theta\right)[/math], assuming the angle is in standard position.[br][br]Since the signs of the coordinates depend on the quadrant, the signs of sine, cosine, and tangent will also depend on the quadrant.[br][br]We can determine the coordinates of the point on the unit circle by using [math]\theta'[/math], the [i]reference angle[/i] of [math]\theta[/math]. This is the acute angle formed between the terminal side of [math]\theta[/math] and the [math]x[/math]-axis. Completing the right triangle will get us the ratios for [math]\theta'[/math], which will be identical to the ratios for [math]\theta[/math], except that we may need to attach a negative sign depending on the quadrant.[br][br]You can drag the slider for the angle and see how the red reference angle changes and where the right triangle is that will allow us to find the coordinates of the point on the unit circle and, in turn, the ratios of [math]\theta[/math].
Multiplying Complex Numbers
This graph shows how we can interpret the multiplication of complex numbers geometrically.[br]Given two complex numbers:[br][math]w=a+bi[/math], [math]z=c+di[/math] where [math]a,b,c,d\in\mathbb{R}[/math][br][br]Consider their product[br][math]wz=\left(a+bi\right)z=az+biz[/math][br][table][tr][td]1[/td][td][math]az[/math][/td][td]Dilate [math]z[/math] by a scale factor of [math]a[/math][/td][/tr][tr][td]2[/td][td][math]iz[/math][/td][td]Rotate [math]z[/math] by [math]90^\circ[/math] about [math]0[/math][/td][/tr][tr][td]3[/td][td][math]biz[/math][/td][td]Dilate [math]iz[/math] by a scale factor of [math]b[/math][/td][/tr][tr][td]4[/td][td][math]az+biz[/math][/td][td]Translate [math]az[/math] by [math]biz[/math][/td][/tr][/table][br]Focus on the two right triangles in the diagram:[br][list=1][*]The right triangle formed by [math]w[/math], [math]0[/math] and the positive real axis.[/*][*]The right triangle formed by [math]az[/math], [math]biz[/math] and [math]0[/math][br][br][/*][/list]The first right triangle has sides of length: [math]a[/math], [math]b[/math], [math]\left|w\right|[/math].[br]The second right triangle has sides of length [math]a\left|z\right|[/math], [math]b\left|z\right|[/math], and [math]\left|wz\right|[/math].[br][br]Since we have the proportion: [math]\frac{a\left|z\right|}{a}=\frac{b\left|z\right|}{b}[/math], we can conclude the triangles are similar since two pairs of corresponding sides are proportional and their included angles (the right angles) are congruent.[br][br]This has two implications:[br][list=1][*]The ratio of similitude is [math]\left|z\right|[/math], which means that [math]\left|wz\right|=\left|w\right|\left|z\right|[/math] (this is an alternative to the algebraic proof you did for homework)[/*][*]The angle formed by [math]wz[/math], [math]0[/math] and [math]az[/math] is congruent to [math]Arg\left(w\right)[/math], since they are corresponding angles of similar triangles[/*][/list][br]This leads us to our other conclusion, that [math]Arg\left(wz\right)=Arg\left(z\right)+Arg\left(w\right)[/math][br][br]Key results:[br][math]\left|wz\right|=\left|w\right|\left|z\right|[/math][br][math]Arg\left(wz\right)=Arg\left(w\right)+Arg\left(z\right)[/math]
Exponential graph as 2-variable function
Locus Definition of a Parabola
Click and drag the point [math]D[/math] on [math]y=-p[/math] to trace the locus of points that are equidistant from [math]y=-p[/math] and point [math]A[/math]. Adjust the slider for [math]p[/math] to change the distance from the origin to the focus, [math]A[/math], and directrix, [math]y=-p[/math].
Tossing a fair coin n times
How can we use the Normal Curve to approximate the probabilities?
Suppose you toss a fair coin [math]\left(P\left(H\right)=\frac{1}{2}\right)[/math] [math]n[/math] times. What is the probability of getting at most [math]r[/math] heads? We can answer this question directly using binomial probability. This corresponds to adding the areas of the [math]0[/math] through [math]r[/math] rectangles of the binomial distribution. Alternatively, we can approximate it using a normal distribution with mean [math]\mu=np[/math] and standard deviation [math]\sigma=\sqrt{np\left(1-p\right)}[/math].[br][br]Below the normal curve and binomial distribution are shown for tossing the coin 30 times. Notice that the area under the curve and the area included by the rectangles are slightly off. In order to get a good approximation, we need to include the right half of the last rectangle, by using an upper bound of [math]r+0.5[/math] when we compute the cumulative normal distribution.