6de jaar 4(+1) uur wiskunde
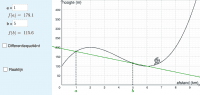
Tabla de Contenidos
- Differentiaalrekening
- Gemiddeld hoogteverschil en hellingsgraad
- Differentiequotiënt versus afgeleide
- Betekenis afgeleide
- sinusfunctie: kenmerken
- cosinusfunctie: kenmerken
- tangensfunctie: kenmerken
- Kenmerken exponentiële functie
- De logaritmische en de exponentiële functie
- Kenmerken van logaritmische functies
- Afgeleide exponentiële functie
- Integraalrekening
- Riemannsom en oppervlakte.
- omwentelingsoppervlakken
- inhoud: benadering door cilinders
- Kansrekening
- Introduction to Probability ---- The Rolling of a Die
- Op den duur
- Statistiek
- centrale limietstelling
Gemiddeld hoogteverschil en hellingsgraad
Riemannsom en oppervlakte.
Onderzoek de invloed van het aantal rechthoekjes op de nauwkeurigheid van de benadering van de werkelijke oppervlakte. [br]Bekijk ook of de onder of bovensom een betere benadering geeft, of is er geen verschil tussen de twee?
Introduction to Probability ---- The Rolling of a Die
This GeoGebra worksheet simulates the rolling of a die. Click on one of the buttons "Roll the die once", "Roll the die 10 times" and "Roll the die 100 times" to begin. The results of the die rolls are recorded in the frequency table. [br][br][math]Experimental \; Probability = \frac{Frequency}{Total \; number \; of \; rolls}[/math][br][br]Click on the button "Start all over again" to clear the frequency table and the roll count.
[list=1][br][*]How many possible values are there?[br][*]Express the fraction [math]\frac{1}{6}[/math] as a decimal correct to 2 decimal places. [br][*]As you keep rolling the die, do you notice the Experimental Probability getting closer to the decimal value you have found above?[br][/list]
centrale limietstelling
We kiezen lukraak n reële getallen tussen 1 en 11. Daarvan nemen we het gemiddelde.[br][br]Dit doen we N keer. Elk gemiddelde noteren we in een dataset. Met deze N getallen in de dataset maken we een histogram. We berekenen ook het gemiddelde van deze N getallen en de steekproefstandaardafwijking.