TCM Talk 2025

In this interactive session, we will look at various ways to utilize GeoGebra to enhance student engagement and deepen mathematical understanding through looking at how it can be used in various courses. Through demonstrations and illustrative examples, we will see how interactive visualizations and dynamic constructions can bring abstract concepts to life. I plan to illustrate ways I’ve incorporated GeoGebra in my courses and how to use GeoGebra resources to help with your courses.
Tabla de Contenidos
- What is GeoGebra
- How my interest in GeoGebra Developed
- How my interest in GeoGebra developed
- Student engagement with GeoGebra afterwards
- Ways to use GeoGebra in Algebra I
- Are women faster than men?
- Olympics Linear regression
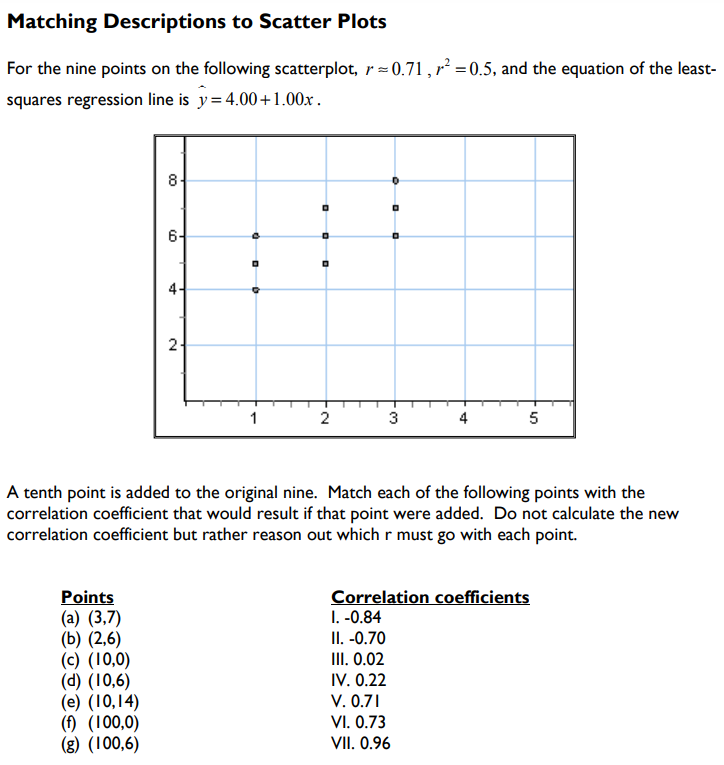
- Correlation Exploration
- Ways to use GeoGebra in Statistics
- Outliers and Influential Points
- The Power of a Test
- Ways to use GeoGebra in Differential Equations/Math Modeling
- Bifurcations introduction
- Bifurcation intro built
- Visualizing Bifurcations
- Atmospheric CO2
- Hill Keller Model
- Eigenvalue/Eigenvector Demo
- Ways to implement using GeoGebra in your class
- Resources: A book
- Resources: YouTube
- Resources: Websites
- Conclusion
- Questions?
- Extra Builds
- The Dog Park Problem
How my interest in GeoGebra developed
SIR Model in GeoGebra
Are women faster than men?
Olympic Model 200m Worksheet
This activity integrates data entry, graphing, regression analysis, and model interpretation using GeoGebra. Through both historical and updated data, students are encouraged to critically evaluate the predictive power and limitations of simple linear models in the context of athletic performance.
Graph to complete during talk
Outliers and Influential Points
Bifurcations introduction
Problem 1a (from IODE)
After allowing their fish hatchery equilibrated at 25000 fish (without any harvesting), the owners[br]of fish.net have decided to allow harvesting based on the model [math]\frac{dP}{dt}=2P\left(1-\frac{P}{25}\right)-k[/math]. In this[br]model, P is the number of fish in thousands, and k is a harvesting rate measured in thousands[br]of fish per year. They initially allow a harvesting rate k = 12. If they allow fishing to continue[br]for a while at this rate, what does their model predict for the long term number of fish in the[br]lake?
Problem 1b
The early years of fish harvesting went well, so they increased the harvesting rate by a modest[br]amount. They now allow harvesting rate corresponding to k = 13. What does this model predict[br]will be the long term result of this fishing practice?
Problem 1c
The owners of fish.net panicked when their fish population reached P = 5 and decided to return[br]to their original business model with k = 12. Will the fish population return to the levels you[br]described in problem 1a? Why or why not?[br]

Questions?
Contact Info
cflournoy@asfa.k12.al.us
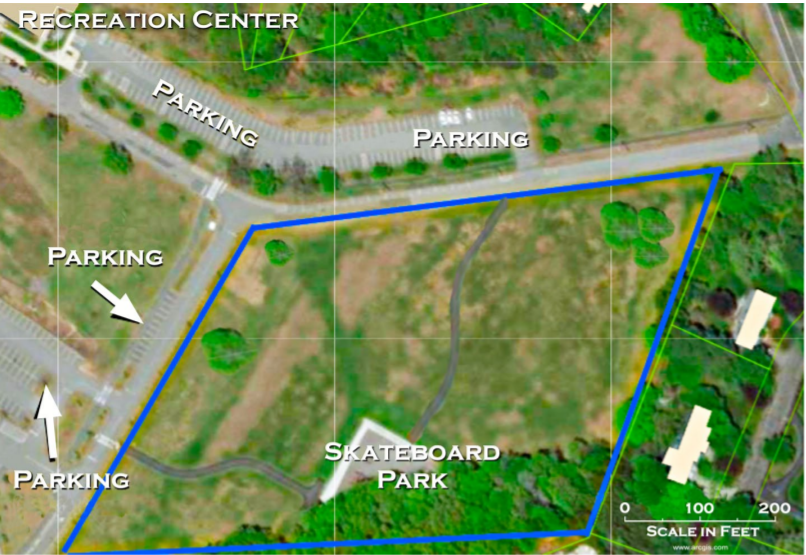
The Dog Park Problem
The Dog Park Problem
1. You may locate the dog park anywhere within the area outlined in blue.[br]2. The dog park may be up to 1-acre (43,560 square feet) in total size. [br]3. You must keep the existing skateboard park in its current location.[br][br][br]