Extremums Using Derivatives: The First Derivative Test
[size=200][size=150][center]A derivative function has so many capabilities. Did you know you can find a function's local extremum using only its derivative? This is an [color=#ff0000][b]essential[/b][/color] skill in calculus, because there may be situations where no calculator is allowed, and/or you aren't given the original function or its graph.[br][/center][b][color=#1e84cc]The Plan:[br][/color][/b][/size][/size][list][*][b][color=#1e84cc]Explore[/color][/b] the relationship between local extrema and derivative functions [/*][*]identify extremums of a function (ie. maximums, minimums) on an [b]open[/b] interval by using the [color=#1e84cc][b]First Derivative Test[/b][/color][/*][*]conclusion[/*][/list][center]Do you think you can do it? Let's explore![/center]
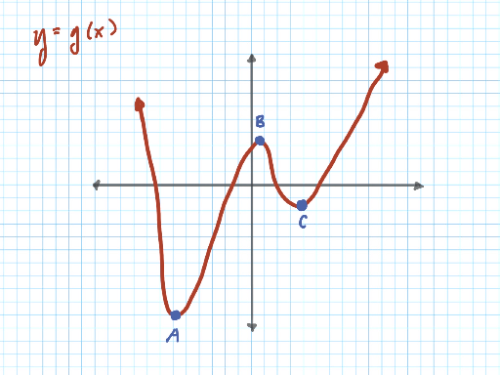
[size=150][b][center][size=200][color=#1e84cc]Exploration[/color][/size][/center][br][/b][/size]Look the graph [math]g[/math] below. The local extrema are marked: points A, C are local minimums; point B is a local maximum.
What do you notice about the graph surrounding the local extrema?
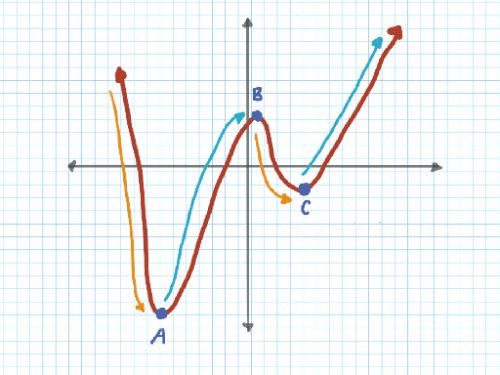
The [color=#ff7700]orange[/color] indicates where [math]g[/math] is decreasing, and the [color=#1e84cc]turquoise[/color] indicates where [math]g[/math] is increasing.
When there's a [b][color=#1e84cc]local minimum, [/color][/b][math]g[/math][b][color=#1e84cc] changes from decreasing to increasing.[/color][/b] When there's a [color=#1e84cc][b]local maximum, [/b][/color][math]g[/math][b][color=#1e84cc] changes from increasing to decreasing. [/color] [/b]The image below shows how this property applies to a variety of functions.[br][br]
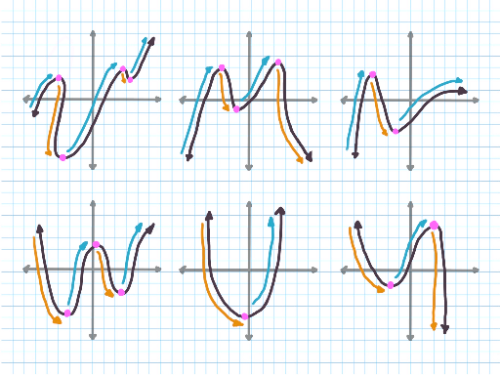
The [color=#ff7700]orange[/color] indicates where the function is decreasing, the [color=#1e84cc]turquoise[/color] indicates where the function is increasing, and the [color=#ff00ff]pink[/color] indicates local extrema.
Now let's look at the graph of [math]g'[/math]. A, B, and C of [math]g'[/math] have the same x-value as the A, B, and C in [math]g[/math].
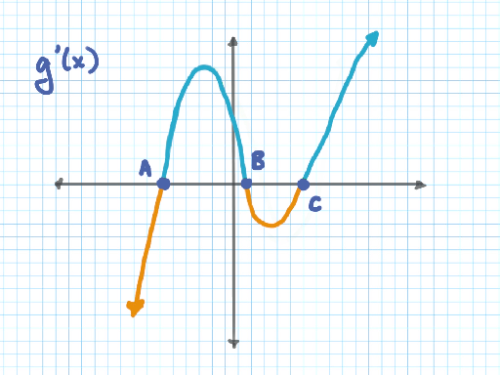
The [color=#ff7700]orange[/color] indicates where [math]g'[/math] is negative, and the [color=#1e84cc]turquoise[/color] indicates where [math]g'[/math] is positive.
[b][color=#1e84cc]Remember:[/color] [/b] where [math]g[/math] is decreasing, [math]g'[/math] is negative. Where [math]g[/math] is increasing, [math]g'[/math] is positive. This makes sense because a decreasing function has a negative slope, and vice versa.
According to the graph, points A, B, and C have a slope of 0. This means points A, B, and C are [b][color=#1e84cc]critical points[/color][/b]. Critical points are points where the derivative of a function is equal to 0, or the value does not exist.
Look at the graph of [math]g'[/math] again. What do you notice about the graph surrounding the critical points?
Hmm... interesting. Now let's compare the graph of [math]g[/math] with the graph of [math]g'[/math].
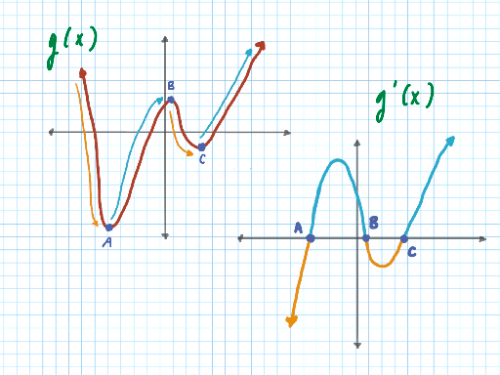
Note: the x-value of points A, B, and C remain the same in the derivative.
The derivative of local extremums A, B, C are also critical points. What can we conclude from this?
[b][color=#1e84cc]Critical points can indicate where local extrema are. [br][br][/color][/b]The graph surrounding critical points can also indicate what type of local extreme lies at that x-value.
We know A and C are local minimums. Look at A and C on [math]g'[/math]: what happens to the graph at these points?
We know B is a local maximum. Look at B on [math]g'[/math]: what happens to the graph at this point?
With this information, we can conclude two things: [br]1) there is a [b][color=#1e84cc]local minimum when a derivative function changes from negative to positive[/color][/b][br]2) there is a [color=#1e84cc][b]local maximum when a derivative function changes from positive to negative[/b][/color][br][br][center][b][color=#ff0000]Now let's apply what we learned to a problem.[/color][/b][/center]
[center][/center][size=200][color=#1e84cc][center][b][/b][b]The First Derivative Test[/b][/center][/color][/size]
[center][size=150][i]The function [/i][math]f[/math][i] is continuous and differentiable for all x. Without a calculator, find the coordinates of the local minimum and maximum of [/i][math]f[/math][i] if [/i][math]f\left(x\right)=x^3-12x-5[/math][i].[/i][/size][/center]
How do we go about this if we aren't given the graph of [math]f[/math]? Well, lets use the [b][color=#1e84cc]First Derivative Test[/color][/b]. First, we must find the derivative of [math]f[/math].
What is the derivative of [math]f\left(x\right)=x^3-12x-5[/math]?
Now that we have the derivative, let's find the critical points of [math]f'[/math], or where [math]f'\left(x\right)=0[/math].
If [math]f'\left(x\right)=0[/math], x = ?
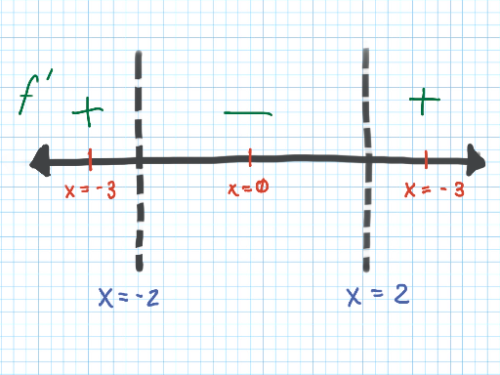
Great! Next Step: we need to make a [b][color=#1e84cc]sign chart[/color][/b].
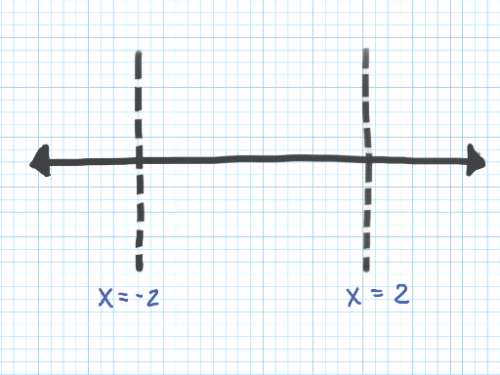
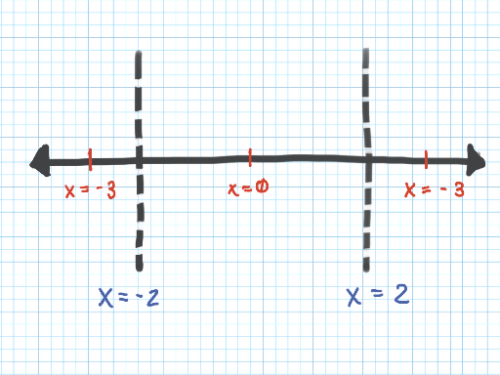
This is a sign chart. Sign charts are composed of a number line and asymptotes that are at the x-values of the critical points. In this problem, the asymptotes are at x=-2 and x=2.
In the image above, notice we've created three sections: -∞ < x < -2, -2 < x < 2, and 2 < x <∞. Now we choose three x-values, one in each interval. Let's use x=-3, x=0, and x=3. Mark these values on your sign chart.
Let's go back to the derivative function [math]f'\left(x\right)=3x^2-12[/math]. Now we have to solve for f' when x=-3, x=0, and x=3. Are these values positive or negative?
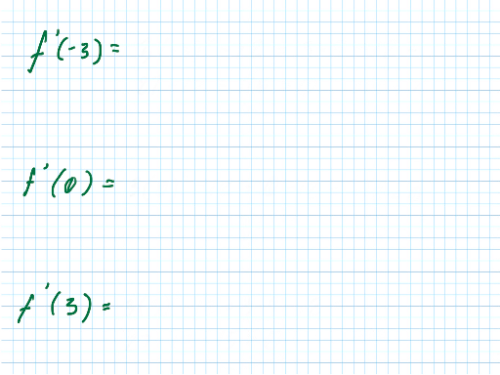
[math]f'\left(-3\right)=?[/math], [math]f'\left(0\right)=?[/math], [math]f'\left(3\right)=?[/math]
Great!
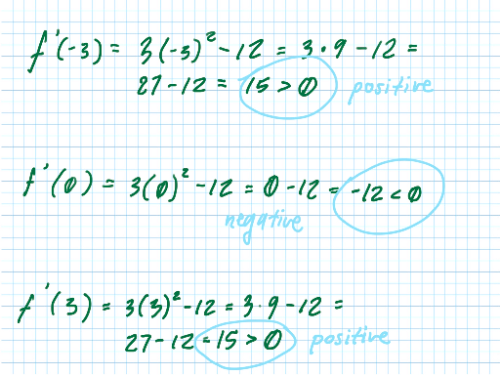
Now let's go back to our sign chart--we want to use our newfound information and apply it to the chart. We know [math]f'\left(-3\right)>0[/math], [math]f'\left(0\right)<0[/math], and [math]f'\left(3\right)>0[/math]. Let's put these symbols in their respective sections of the chart.
[b][color=#1e84cc]Looking at What We Learned Before[/color][/b][br][br]1) there is a [b][color=#1e84cc]local minimum when a derivative function changes from negative to positive[/color][/b][br]2) there is a [color=#1e84cc][b]local maximum when a derivative function changes from positive to negative[/b][/color][br][br]Do you see why we marked the sections of the sign chart with either positive or negative symbols? We want to find where the function is decreasing or increasing, and these symbols tell us just that. [br][br]Also, when a derivative function changes from positive to negative or vice versa, it occurs when the graph crosses the x-axis (or when the derivative = 0). This is why we use critical points to lead us to the extremums.
At what x-value does the local [b]maximum[/b] occur? Justify your answer.
At what x-value does the local [b]minimum[/b] occur? Justify your answer.
We're not done yet! The question asks for the coordinates, but we only have our x-values so far. We know [math]f\left(x\right)=x^3-12x-5[/math], so lets solve for [math]f\left(-2\right)[/math] and [math]f\left(2\right)[/math].
The local maximum occurs at (__,__).[br]The local minimum occurs at (__, __).[br]
Let's check our work! Use the GeoGebra applet below to find the local extrema of [math]f\left(x\right)=x^3-12x-5[/math].[br]Use the extremum tool and click on the function.
Compare your answers to the actual answers. Are they the same?[br]
[center][color=#1e84cc][b][size=200]Conclusion[/size][/b][/color][/center]
What can we take away from this? We discovered by using the[b] [color=#1e84cc]First Derivative Test[/color][/b], you can find the local extremum of a function on an [b]open[/b] interval. Now you know a valuable skill for calculus that also applies to the real world! [br][br][i]But what if the function is on a [b]closed[/b] interval? Continue to the [b][color=#1e84cc][url=https://www.geogebra.org/m/jzgse84e]Candidates Test Activity[/url] [/color][/b]to find out how.[/i]