Dale A1.FIF.7 Introduction to Exponential Growth & Decay (Illustrated Meaning)
[color=#0000ff][b]Whenever a quantity increases by a certain percentage per unit time, this quantity is said to grow exponentially. [/b][/color] [br][br][color=#cc0000][b]Whenever a quantity decreases by a certain percentage per unit time, this quantity is said to decay exponentially. [/b][/color][br][br]Interact with the following applet for a few minutes, then answer the questions that follow.
Exponential Functions
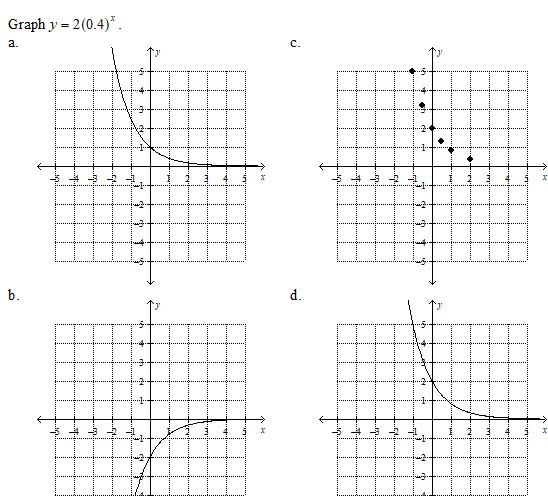
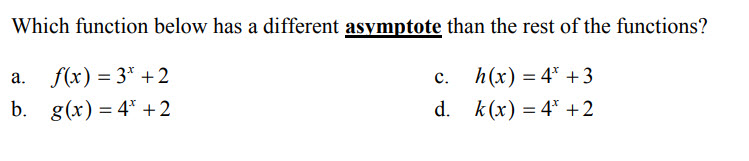
Notice that now our independent variable (x) is the exponent! Look at the graph and slide the blue slider. When our base (the number being raised by x) is greater than 1, our graph shoots up! This is called exponential growth because our y's get bigger exponentially. When our base is less than 1 (between 0 and 1), our graph shoots down! This is called exponential decay because our y's are getting smaller exponentially. Notice that you can also drag the y-intercept up or down. The dotted line beneath the y-intercept is called an asymptote. An asymptote is an imaginary line that our exponential graph is trying to touch, but it never does!
What value or values do/does the base have to assume in order for the function to GROW exponentially?
What value or values do/does the base have to assume in order for the function to DECAY exponentially?
What happens if base = 1?
GeoGebra Graphing Calculator
GeoGebra also has a great graphing calculator (and it's free!) You will need a graphing calculator for this unit. Please use this one!
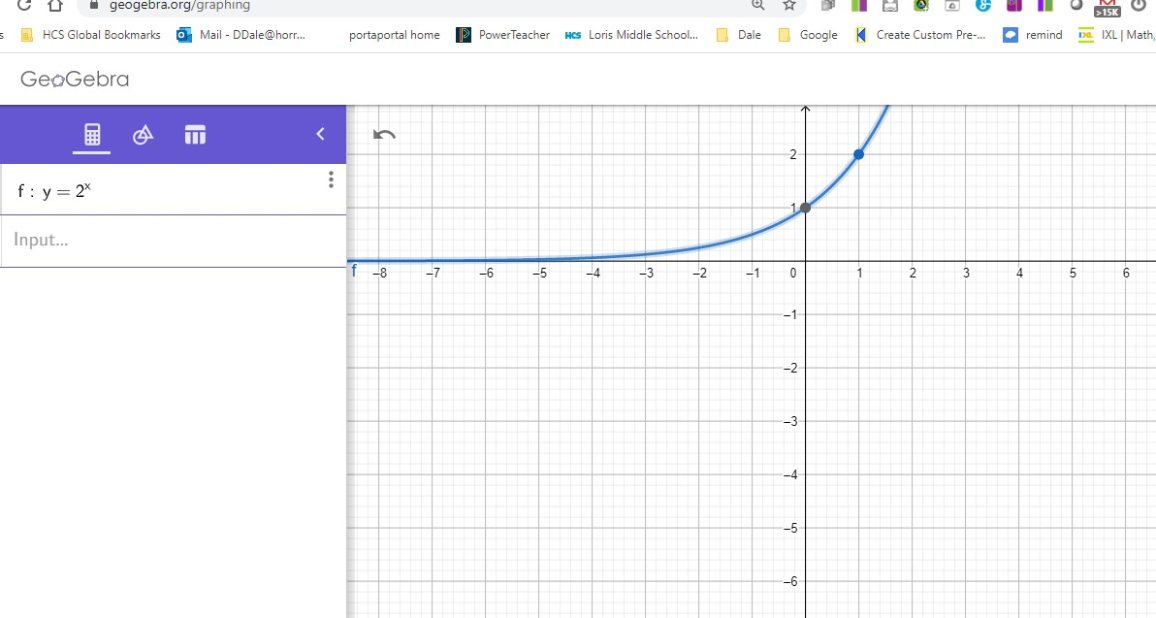
GeoGebra Graphing Calculator
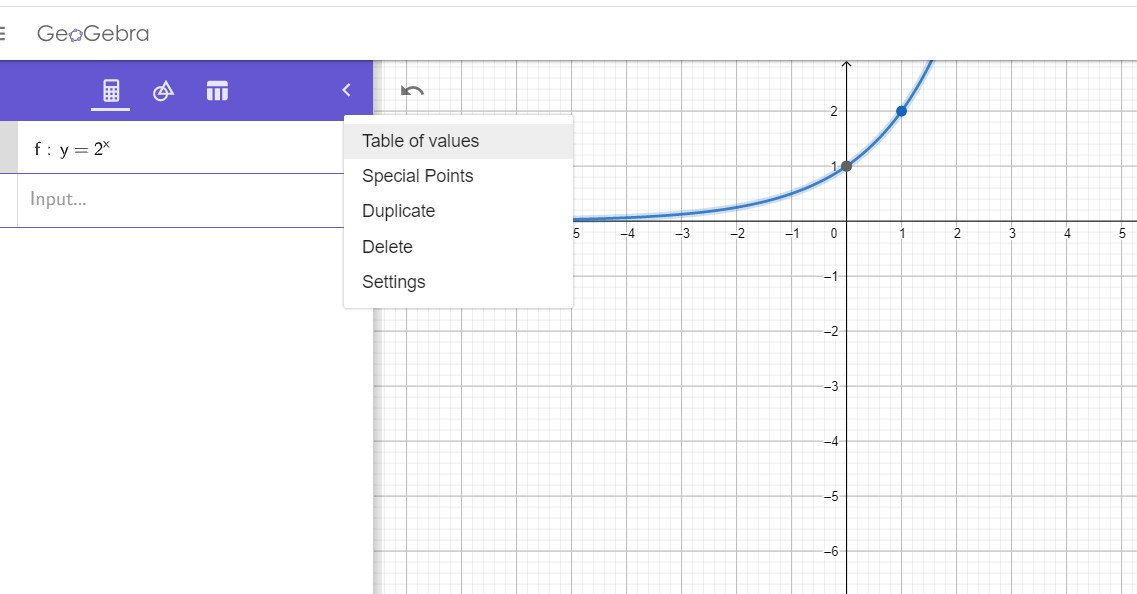
Notice that you can enter the equation. Use ^ to enter the exponent (x). You can press the snowman (three dots) and look at the table of values similar to what we did in class when we pressed 2nd and y=.
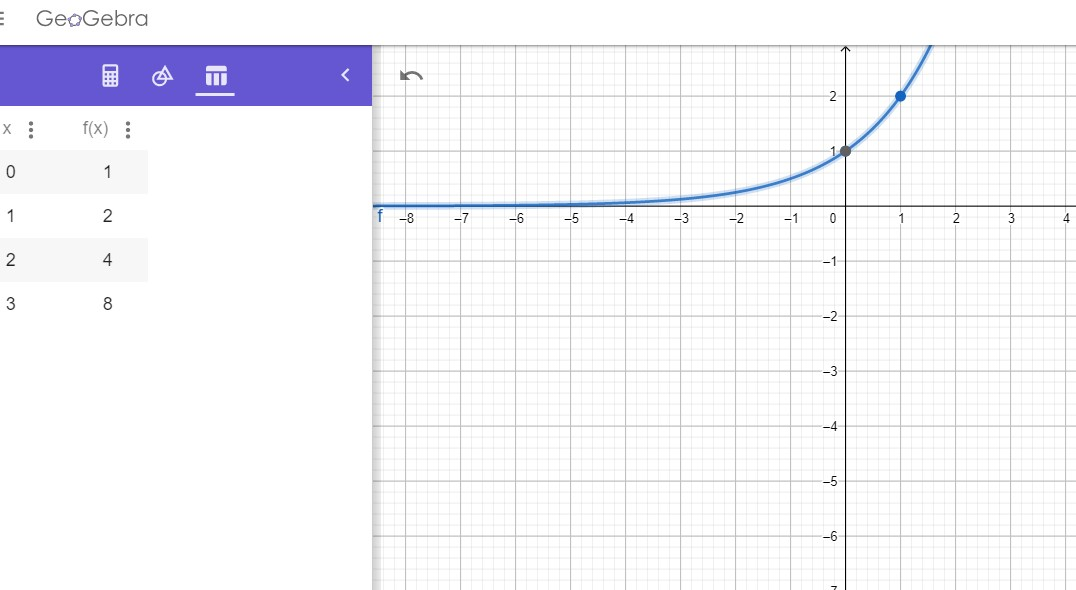
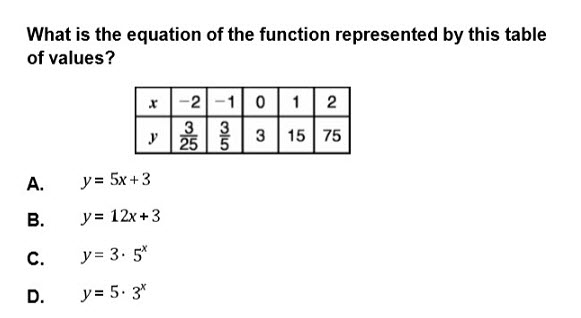
Notice the table of values? Everytime x increases by 1, the value of y starts of at 1 but gets multiplied by 2 (the base)! How cool is that! Note that y never gets to be zero. So, 0 is our asymptote.
question 1
Question 2
Question 3
Question 4
Answer Section. Place answers to questions 1-4 below.
#1 __________[br]#2 _________[br]#3 _________[br]#4 __________