Upoznajte Grafički kalkulator

Dobro došli [url=https://www.geogebra.org/graphing]Grafički kalkulator[/url]! Naučite kako crtati grafove funkcija, istražiti jednadžbe, prikazivati podatke, i još mnogo toga u ovom priručniku.
Tabla de Contenidos
- First Steps
- Comparison of GeoGebra Math Apps
- Upute
- Istražite aplikaciju
- Algebarski prikaz
- Tools View
- Table View
- Graphics View
- Basic
- Sjecište funkcija
- Kvadratna funkcija
- Funkcija sinus
- Prostoručno crtane funkcije
- Tablica vrijednosti
- Boja, veličina i stil
- Imena varijabli u funkcijama
- Advanced
- Complex numbers
- Exploring the integral
- Monotonicity of a function
- Conjunctions of inequalities
- YouTube tutorials
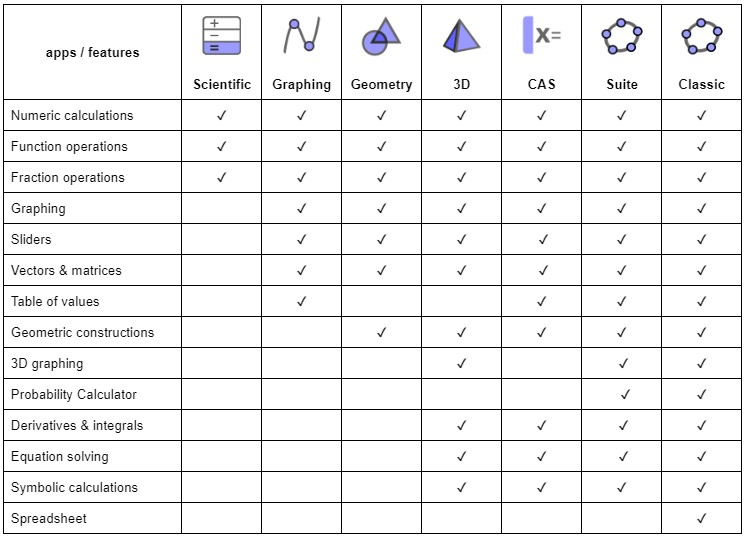
Comparison of GeoGebra Math Apps
With our [i]GeoGebra[/i] math apps you can explore and learn functions, geometry, algebra, statistics and 3D in new and interactive ways.[br][list][*][url=http://www.geogebra.org/scientific]Scientific Calculator[/url][br][/*][*][url=https://www.geogebra.org/graphing]Graphing Calculator[/url][br][/*][*][url=https://www.geogebra.org/geometry]Geometry[/url][br][/*][*][url=https://www.geogebra.org/calculator]Calculator Suite[/url][/*][*][url=https://www.geogebra.org/cas]CAS Calculator[/url][br][/*][*][url=https://www.geogebra.org/3d]3D Calculator[/url][/*][*][url=https://www.geogebra.org/classic]GeoGebra Classic[/url][br][/*][/list]The right app for you is the one that meets your own needs and, if used in tests, fulfills exam regulations of your region. The following table gives an overview of which features are available in which apps.
GeoGebra in Exams
We believe that students benefit from using the exact same GeoGebra app in class, for homework and during tests. This way, they will get the most practice with the app and therefore be able to make the best use of our technology in all situations. That's why we have created our [url=https://www.geogebra.org/m/y3aufmy8]GeoGebra Exam Mode[/url] and added it within each one of our apps. The exam mode locks down mobile devices so students cannot communicate or use any other apps than GeoGebra during a test. This approach has already been field-tested and approved by several ministries of education in several regions. Read more about how to use [url=https://www.geogebra.org/m/y3aufmy8]GeoGebra in exams[/url].[br][br]
Sjecište funkcija
Zadatak
Nacrtajte linearnu funkciju s klizačima i odredite njeno sjecište s kvadratnom funkcijom. [br][br]Istražite konstrukciju i naučite kako crtati funkciju s parametrima, te kako odrediti sjecište dviju funkcija s [i][url=https://www.geogebra.org/graphing]Grafičkim kalkulatorom[/url][/i]. Zatim to pokušajte sami, slijedeći upute u nastavku.[br]
Istražite konstrukciju...
Upute
[table][tr][td]1.[/td][td][/td][td]Nacrtajte linearnu funkciju unosom[math]f(x)=a\cdot x+b[/math] u [i]Traku za unos[/i]. Klizači za varijable a i b će biti automatski kreirani.[/td][/tr][tr][td]2.[/td][td][/td][td]Omogućite [i]Vidljivost [/i]uz pomoć oznake (kruga) ispred klizača kako bi klizač bio vidljiv u [i]Grafičkom prikazu.[/i][br][/td][/tr][tr][td]3.[/td][td][/td][td]Mijenjajte vrijednosti klizača [i]a [/i]i [i]b [/i]i istražite kako to utječe na promijenu grafa [i]f(x).[/i][br][/td][/tr][tr][td]4.[/td][td][/td][td]Nacrtajte kvadratnu funkciju tako što ćete upisati [math]g\left(x\right)=x^2[/math] u [i]Traku za unos[/i][i].[/i][/td][/tr][tr][td]5.[/td][td][/td][td]Koristite naredbu [math]Sjecište\left(f,g\right)[/math] kako biste odredili sjecišta funkcija [i]f(x) [/i]i [i]g(x). [/i]Točke presjeka [i]A [/i]i [i]B [/i]će se pojaviti u [i][i]Grafičkom prikazu[/i][/i], dok će se koordinate tih točaka pojaviti u [i]Algebarskom prikazu.[/i][/td][/tr][tr][td][/td][td][icon]/images/ggb/toolbar/mode_intersect.png[/icon][/td][td][b]Napomena:[/b] Možete koristiti i alat [i]Sjecište [/i]iz [i]Alatne trake, [/i]označite funkcije čije sjecište želite odrediti.[/td][/tr][tr][td]6.[/td][td][/td][td]Pomičite klizače [i]a [/i]i [i]b [/i]i istražite kako se točke sjecišta [i]A [/i]i [i]B [/i]ponašaju s obzirom na te promjene.[/td][/tr][tr][td]7.[/td][td][img width=24,height=24]https://lh5.googleusercontent.com/EeYLvel9HmsnYD7ZRVm-HBQtblHhlB35cdQzXdG11nyuG3R7BCgnyC_l3L8aKn1R4wNkQnlMJHA72jcGN8n5f2RRahLZMiuy01yMfDJFEssc0gxkkfajbgHSyt1KTilGP0RyH5NA[/img][/td][td]Označite grafove funkcija [i]f(x) [/i]i [i]g(x) [/i]i promijenite boju grafa koristeći [i]Traku stilova[/i] kako bi poboljšali svoju konstrukciju.[/td][/tr][/table]
Pokušajte sami...
Complex numbers
Task
Determine a complex number and change the coordinates of the complex number to polar coordinates. [br][br]Explore the construction and learn how to visualize complex numbers on a polar coordinate grid with [i][url=https://www.geogebra.org/graphing]GeoGebra Graphing Calculator[/url][/i]. Then try it yourself by following the instructions below.
Explore the construction...
Instructions
[table][tr][td]1.[/td][td][img width=32,height=32]https://geogebra.github.io/docs/manual/en/_images/tutorials/32px-Algebra_new.svg.png[/img][/td][td]In the [i]Algebra View [/i]open the [i]Input Help[/i] and choose [i]Text[/i]. [/td][/tr][tr][td]2.[/td][td][/td][td]Copy the following text into the [i]Input Bar [/i]and press [i]Enter[/i]:[/td][/tr][tr][td][/td][td][/td][td]CCSS.MATH.CONTENT.HSN.CNB.4[br]Represent complex numbers on the complex plane in rectangular and polar form (including real and imaginary numbers), and explain why the rectangular and polar form of a given complex number represent the same number.[/td][/tr][tr][td]3.[/td][td][icon]https://www.geogebra.org/images/ggb/toolbar/mode_complexnumber.png[/icon][/td][td]Open the [i]Tools View [/i]and search for the [i]Complex Number[/i] tool. Select this tool and click anywhere inside the [i]Graphics View[/i] to create a complex number. [br][b]Note:[/b] The complex number will automatically be labeled [i]z[sub]1[/sub][/i] and its coordinates will be displayed in the [i]Algebra View[/i].[br][/td][/tr][tr][td]4.[/td][td][img width=32,height=32]https://geogebra.github.io/docs/manual/en/_images/tutorials/32px-Menu-options.svg.png[/img][/td][td]Open the global settings and change the font size.[/td][/tr][tr][td]5.[/td][td][img width=16,height=16]https://geogebra.github.io/docs/manual/en/_images/tutorials/16px-Stylingbar_caption.svg.png[/img][img width=16,height=16]https://geogebra.github.io/docs/manual/en/_images/tutorials/16px-Stylingbar_point.svg.png[/img][/td][td]Select the complex number in the [i]Graphics View [/i]and change its settings. In the label menu mark [i]Show Value[/i]. Change the point size as well.[br][b]Note:[/b] In the Mobile App open the context menu by pressing the [i]More [/i]button. Then on [i]Set caption style[/i] select [i]Value[/i].[/td][/tr][tr][td]6.[/td][td][img width=32,height=32]https://geogebra.github.io/docs/manual/en/_images/tutorials/32px-Algebra_hidden.svg.png[/img][/td][td]Enter [math]z_2=z_1[/math] into the [i]Input [/i][i]Bar, [/i]press [i]Enter [/i]and hide the new complex number by selecting the enabled [i]Visibility [/i]button on the left.[/td][/tr][tr][td]7.[/td][td][img]https://geogebra.github.io/docs/manual/en/_images/tutorials/16px-Icon-menu.svg.png[/img][/td][td]In the [i]Algebra View [/i]open the context menu by pressing the [i]More [/i]button of [i]z[sub]2[/sub][/i] and select [i]Settings[/i]. Open the tab [i]Algebra[/i]. Change the coordinates into [i]Polar Coordinates[/i] and close the settings. The complex number [i]z[sub]2[/sub][/i] will now be displayed in polar coordinates in the [i]Algebra View[/i].[br][b]Note: [/b]In the Mobile App enter [math]z_2=ToPolar(z_1)[/math] in order to show its polar coordinates in the [i]Algebra View[/i].[/td][/tr][tr][td]8.[/td][td][icon]https://www.geogebra.org/images/ggb/toolbar/mode_move.png[/icon][/td][td]Move the point [i]z[sub]1[/sub][/i] in the [i]Graphics View [/i]and explore how the values change in the [i]Algebra View[/i].[/td][/tr][tr][td]9.[/td][td][img width=32,height=32]https://geogebra.github.io/docs/manual/en/_images/tutorials/32px-Menu-options.svg.png[/img][/td][td]Open the S[i]ettings [/i]and select [i]Show Grid[/i]. Activate a [i]Polar [/i]grid.[br][b]Note:[i] [/i][/b]In the Mobile App select [i]Show Grid [/i] and change [i]Grid Type[/i] to [i]Polar.[/i][br][/td][/tr][/table]