Learn CAS Calculator

Welcome to the [url=https://www.geogebra.org/cas]GeoGebra CAS Calculator[/url]! Learn how to solve equations, expand and factor expressions, find derivatives and integrals and much more in this tutorial.
Índice
- First Steps
- Comparison of GeoGebra Math Apps
- Introduction
- Explore the app
- Basics
- Defining functions
- Terms and variables
- Solving equations and inequalities
- Solving systems of equations
- Limits of functions
- Calculating derivatives
- Definite and indefinite integral
- Advanced
- Rational function
- Volume of revolution
- Curve sketching
- Fourth degree polynom
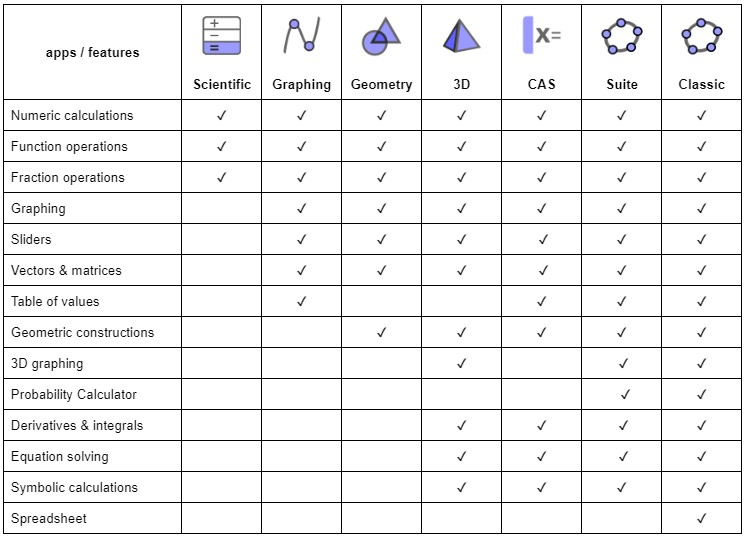
Comparison of GeoGebra Math Apps
With our [i]GeoGebra[/i] math apps you can explore and learn functions, geometry, algebra, statistics and 3D in new and interactive ways.[br][list][*][url=http://www.geogebra.org/scientific]Scientific Calculator[/url][br][/*][*][url=https://www.geogebra.org/graphing]Graphing Calculator[/url][br][/*][*][url=https://www.geogebra.org/geometry]Geometry[/url][br][/*][*][url=https://www.geogebra.org/calculator]Calculator Suite[/url][/*][*][url=https://www.geogebra.org/cas]CAS Calculator[/url][br][/*][*][url=https://www.geogebra.org/3d]3D Calculator[/url][/*][*][url=https://www.geogebra.org/classic]GeoGebra Classic[/url][br][/*][/list]The right app for you is the one that meets your own needs and, if used in tests, fulfills exam regulations of your region. The following table gives an overview of which features are available in which apps.
GeoGebra in Exams
We believe that students benefit from using the exact same GeoGebra app in class, for homework and during tests. This way, they will get the most practice with the app and therefore be able to make the best use of our technology in all situations. That's why we have created our [url=https://www.geogebra.org/m/y3aufmy8]GeoGebra Exam Mode[/url] and added it within each one of our apps. The exam mode locks down mobile devices so students cannot communicate or use any other apps than GeoGebra during a test. This approach has already been field-tested and approved by several ministries of education in several regions. Read more about how to use [url=https://www.geogebra.org/m/y3aufmy8]GeoGebra in exams[/url].[br][br]
Defining functions
Task
Define a function, draw its graph in the [i]Graphics View[/i] and specify some function values and arguments.
Explore the construction...
Instructions
[table][tr][td]1.[/td][td]Enter the function in the input line and press Enter to define a new function.[/td][/tr][tr][td][/td][td][b][/b][b]Note[/b]: The graph of f(x) is automatically displayed in the Graph View. [i] [/i][/td][/tr][tr][td]2.[/td][td]Calculate the zeros of f(x) by typing in the input line and pressing Enter. [br][/td][/tr][tr][td]3.[/td][td]Determine the function values for x = -5, x = 0 and x = 2.15 by typing in the input line and pressing Enter.[/td][/tr][tr][td]4.[/td][td]Determine for which arguments x f(x) = 4 by typing in the input line.[/td][/tr][/table][b]Note[/b]: You can switch between [img]https://geogebra.github.io/docs/manual/en/_images/tutorials/24px-Numeric_toggle_button.png[/img] numeric and [img]https://geogebra.github.io/docs/manual/en/_images/tutorials/24px-Symbolic_toggle_button.png[/img] symbolic output after calculating the function values and arguments by selecting the appropriate toggle button.
Try it yourself...
Task
Draw a family of functions and compare their function values using the table view.
Instructions
[table][tr][td]1. [/td][td]Enter the function [math]f\left(a,x\right)=\sqrt{x-a}[/math] in the input line to define a family of functions depending on the parameter a[/td][/tr][tr][td]2. [/td][td]Enter the function [math]f\left(0,x\right)[/math] in the input line and press Enter.[/td][/tr][tr][td][/td][td][b]Note[/b]: The graph of [math]f\left(0,x\right)[/math]is automatically displayed in the Graph View.[/td][/tr][tr][td]3.[/td][td]Repeat step 2 by typing [math]f\left(1,x\right)[/math], [math]f\left(2,x\right)[/math] and [math]f\left(-1,x\right)[/math] and display their graphs in the Graph View.[/td][/tr][tr][td]4.[/td][td]Compare the graphs of the family of functions and describe how they differ.[/td][/tr][tr][td]5.[/td][td]Activate the More button on the right side of [math]f\left(0,x\right)[/math]and select Value Table.[/td][/tr][tr][td]6.[/td][td]In the dialog box, set the start value to -1, the end value to 5 and the step size to 1. Choose OK to confirm your settings.[/td][/tr][tr][td]7.[/td][td]Repeat step 5 for [math]f\left(1,x\right)[/math]to also create a value table for this function. [/td][/tr][tr][td][/td][td]Note: f(0, x) and f(1, x) are automatically designated g(x) and h(x).[/td][/tr][tr][td]8. [/td][td]Compare the function values from [math]f\left(0,x\right)[/math] and [math]f\left(1,x\right)[/math] in the table view.[/td][/tr][/table]
Rational function
Task
Given the function [math]f\left(x\right)=\frac{x^3+3x^2}{x^2+6x+9}[/math].[br][list=1][*]Plot the graph of [i]f(x)[/i].[/*][*]Determine the roots and maximum domain [i]D[/i] of [i]f(x)[/i].[/*][*]Identify the behaviour of [i]f(x)[/i] at the edges of [i]D[/i].[/*][/list]
Explore the construction...
Instructions
[table][tr][td]1.[/td][td]Define the function [i]f(x)[/i] by entering [math]f\left(x\right)=\frac{x^3+3x^2}{x^2+6x+9}[/math] into the [i]Input Bar [/i]and pressing [i]Enter[/i]. [/td][/tr][tr][td][/td][td][b]Note:[/b] [i]GeoGebra CAS Calculator[/i] automatically simplifies the equation of [i]f(x)[/i].[/td][/tr][tr][td]2.[/td][td]Use the command [math]Root(f)[/math] to determine the roots of [i]f(x)[/i].[br][/td][/tr][tr][td][/td][td][b]Note: [/b]You can also use the command [math]Solve(f=0)[/math] to calculate the roots of [i]f(x)[/i].[/td][/tr][tr][td]3.[/td][td]To determine the maximum domain of f(x), calculate the roots of the denominator of f(x) by entering the command [math]Root(Denominator(f))[/math].[br][/td][/tr][tr][td][/td][td][b]Note:[/b] You can also use the command [math]Solve(Denominator(f)=0)[/math].[/td][/tr][tr][td]4.[/td][td]As the solution is [i]-3[/i] we get the maximum domain [math]D=\mathbb{R}\backslash\left\{-3\right\}[/math].[/td][/tr][/table]
Try it yourself...
Instructions (continued)
[table][tr][td]5.[/td][td]Use the [i]Limit[/i] command to identify the behaviour of [i]f(x)[/i] at the edges of [i]D[/i]. [/td][/tr][tr][td][/td][td]Enter the command [math]Limit\left(f,-\infty\right)[/math] into the [i]Input Bar[/i] to identify the behaviour on the left edge.[/td][/tr][tr][td][/td][td]Enter the command [math]Limit\left(f,\infty\right)[/math] into the [i]Input Bar[/i] to identify the behaviour on the right edge.[/td][/tr][tr][td]6.[/td][td]Use the commands [i]LimitBelow[/i] and [i]LimitAbove[/i] to identify the behaviour of [i]f(x)[/i] around [i]-3[/i]. [/td][/tr][tr][td][/td][td]Enter the command [math]LimitBelow\left(f,-3\right)[/math] into the [i]Input Bar[/i].[/td][/tr][tr][td][/td][td]Enter the command [math]LimitAbove\left(f,-3\right)[/math] into the [i]Input Bar[/i].[/td][/tr][tr][td][/td][td][br][/td][/tr][/table]