Documentation
What is domain coloring?
References
[list=1][*]Breda, A. Trocado, A. & Santos, J. (2013). O GeoGebra para além da segunda dimensão. [i]Indagatio Didactica[/i], 5(1). Accessed 12 June 2018 [url=http://revistas.ua.pt/index.php/ID/article/view/2421][/url][/*][*]Davis, J. E. (2017). [i]Complex Domain Coloring[/i], Available online [url=https://www.jedsoft.org/fun/complex/index.html][/url][/*][*]Crone, L. (s.f) [i]Color graphs of complex functions.[/i] [url=http://fs2.american.edu/lcrone/www/ComplexPlot.html][/url][/*][*]Farris, F. (1998). Review of Visual Complex Analysis. By Tristan Needham. [i]The American Mathematical Monthly[/i], 105(6), 570-576. [url=https://www.jstor.org/stable/2589427][/url][/*][*]Farris, F. A. (n.d.). [i]Visualizing complex-valued functions in the plane.[/i] [url=http://www.maa.org/pubs/amm_complements/complex.html][/url][/*][*]Farris, F. A. (2017). Domain Coloring and the Argument Principle. [i]PRIMUS[/i] 27:8-9, 827-844, DOI: [url=https://doi.org/10.1080/10511970.2016.1234526]10.1080/10511970.2016.1234526[/url][/*][*]Losada Liste, R. (2014). El color dinámico de GeoGebra. [i]Gaceta De La Real Sociedad Matematica Española[/i], 17, 525–547, Madrid.[/*][*]Lundmark, H. (2004). [i]Visualizing complex analytic functions using domain coloring.[/i] [url=http://users.mai.liu.se/hanlu09/complex/domain_coloring.html][/url][/*][*]Needham, T. (1997). [i]Visual Complex Analysis.[/i] Oxford University Press, Oxford.[/*][*]Marsden, J. E. & Hoffman, M. J. (1987) [i]Basic Complex Analysis.[/i] (2nd ed.) W. H. Freeman and Co, New York.[/*][*]Poelke, K. & Polthier, K. (2012) Domain coloring of complex functions: An implementation-oriented introduction. [i]IEEE Computer Graphics Math & Applications[/i] 32(5), pp. 90-97, DOI: [url=https://ieeexplore.ieee.org/document/6311374]10.1109/MCG.2012.100[/url][/*][*]Ponce Campuzano, J. C. (2019). [url=http://sinewton.es/revista_numeros/101/]Representación de funciones complejas con GeoGebra usando el método de dominio coloreado.[/url] [Representation of complex functions with GeoGebra using domain coloring.] [i]Números Didáctica de las Matemáticas. [/i]Vol. 101. pp. 85-101.[br][/*][*]Ponce Campuzano, J. C. (2020).[url=http://revistas.pucsp.br/IGISP/article/view/46753] Una introducción al método de dominio colorado con GeoGebra para la visualización y estudio de funciones complejas.[/url] [An introduction to the method domain coloring with GeoGebra for visualizing and studying complex functions] [i]Revista do Instituto GeoGebra de São Paulo. [/i]v. 9, n. 1, p. 101-119.[br][/*][*]Ponce Campuzano, J. C. (2021) [url=https://austms.org.au/wp-content/uploads/2021/10/484Web.pdf]Domain colouring for visualising and exploring the beauty of complex functions.[/url] [i]Australian Mathematical Society Gazette.[/i] Vol. 48, No. 4, pp. 162-170.[/*][*]Ponce Campuzano, J. C. (2019) The use of phase portraits to visualize and investigate isolated singular points of complex functions [i]Journal International Journal of Mathematical Education in Science and Technology.[/i] 50(7), pp. 999-1010, DOI: [url=https://doi.org/10.1080/0020739X.2019.1656829]10.1080/0020739X.2019.1656829[/url][/*][*]Thaller, B. (1998). Visualization of complex functions, [i]Mathematica J.,[/i] Vol. 7, issue 2, [url=https://vqm.uni-graz.at/articles/complexvis/complexvis.pdf][/url][/*][*]Velleman, D. J. (2015). The Fundamental Theorem of Algebra: A Visual Approach. [i]The Mathematical Intelligencer.[/i] 37, 12–21. [url=https://link.springer.com/article/10.1007/s00283-015-9572-7][/url][/*][*]Wegert, E. (2010). Phase diagrams of meromorphic functions. [i]Computational Methods and Function Theory.[/i] 10, 639-661. [url=https://doi.org/10.1007/BF03321784][/url][/*][*]Wegert, E. (2012). [i]Visual Complex Functions: An introduction with phase portraits.[/i] New York: Springer Basel. [url=https://www.springer.com/gp/book/9783034801799][/url][/*][*]Wegert, E. (2016). Visual exploration of complex functions. In T. Qian and L. R. Rodino (eds.), [i]Mathematical analysis, probability and applications – Plenary Lectures SPMS[/i] (Vol. 177. pp. 253–279). Switzerland: Springer International Publishing.[/*][*]Wegert, E. & Semmler, G. (2011). Phase plots of complex functions: a journey in illustration. [i]Notices American Mathematical Society,[/i] 58, 768-780. [url=https://www.ams.org/notices/201106/rtx110600768p.pdf][/url][/*][*]Wikipedia: [i]Domain Coloring[/i] [url=https://en.wikipedia.org/wiki/Domain_coloring][/url][/*][/list]
GGBscript for Domain coloring
The following GGBscript is for implementing the method Domain coloring with HSV scheme: Enhanced phase portrait
Setp 1:
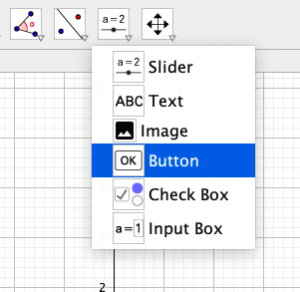
From the menu, select the tool Button.

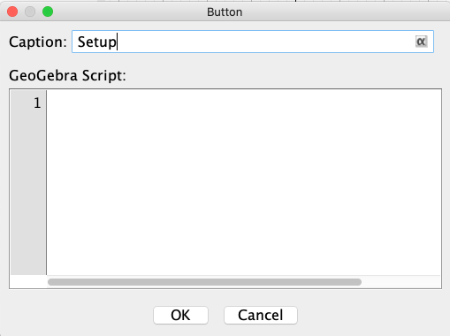
We can type in "Caption" the word "Setup"
Step 2:
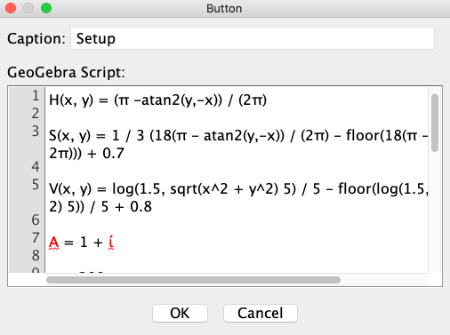
In the window of the [b]Setup[/b] button, we write the following lines:
[code]H(x, y) = (π -atan2(y,-x)) / (2π)[br][br]S(x, y) = 1 / 3 (18(π - atan2(y,-x)) / (2π) - floor(18(π - atan2(y,-x)) / (2π))) + 0.7[br][br]V(x, y) = log(1.5, sqrt(x^2 + y^2) 5) / 5 - floor(log(1.5, sqrt(x^2 + y^2) 5)) / 5 + 0.8[br][br]A = 1 + ί[br][br]n = 200[br][br]A1 = 1[br][br]Execute(Sequence("A"+i+" = A"+(i-1)+"+1", i, 2, n))[br][br]Execute(Sequence("B"+i+" = x(A) + ί * (y(A) + A"+i+"/n)", i, 1, n))[br][br]Execute(Sequence("ShowLabel(B"+i+", false)", i, 1, n))[br]Execute(Sequence("SetPointSize(B"+i+", 1)", i, 1, n))[br]Execute(Sequence("SetTrace(B"+i+", true)", i, 1, n))[br][br]Execute(Sequence("C"+i+" = (B"+i+"-1)/(B"+i+"^2+B"+i+"+1)", i, 1, n))[br]Execute(Sequence("SetVisibleInView(C"+i+", 1, false)", i, 1, n))[br][br]Execute(Sequence("D"+i+" = H(x(C"+i+"), y(C"+i+"))", i, 1, n))[br]Execute(Sequence("E"+i+" = S(x(C"+i+"), y(C"+i+"))", i, 1, n))[br]Execute(Sequence("F"+i+" = V(x(C"+i+"), y(C"+i+"))", i, 1, n))[br][br]Execute(Sequence("SetDynamicColor(B"+i+", D"+i+", 1, E"+i+" F"+i+" )", i, 1, n))[br][br][br][/code]
Sample
Step 3:
Click on OK to close window and then click on this button to create objects.
Step 4:
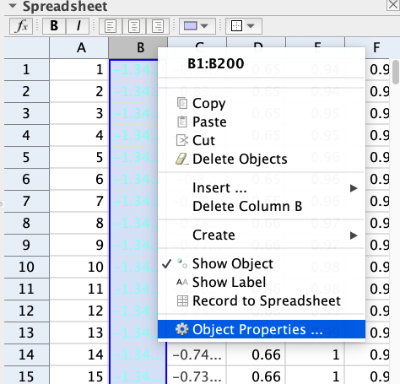
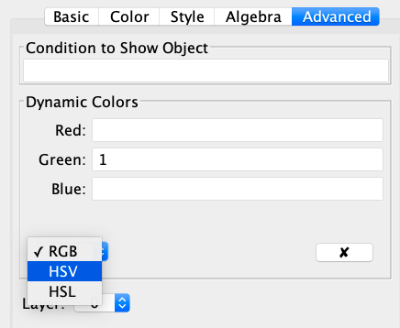
Open the spreadsheet and select column B to open [b]Object Properties[/b]. In the [b]Advanced[/b] tab, select HSV scheme. As shown in the following images.
Step 5:
Finally, click again the [b]Setup[/b] button to apply all changes to all points.
Sample
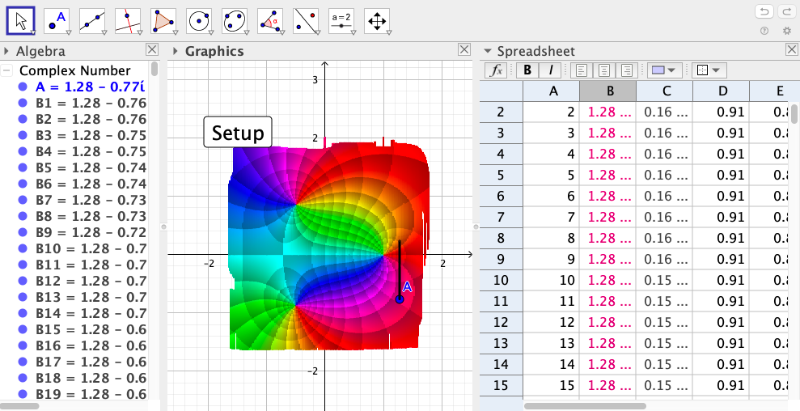
HSL scheme simple
Drag point A.
Domain coloring: HSL
Change the function f(z). Example: 1/z[br][br][b]Updated:[/b] The input function now allows the complex constant [b]i[/b].
Other functions to try:[br][list][*](z-i)/(z^2+i*z+i)[/*][*]exp(1/z)[/*][*]z^3-i*z[/*][*](1-cos(z))/z^2[/*][*]ln(z)[/*][/list][b]Remark:[/b] You must type the operator * for multiplication of variable and complex number [i][b]i[/b][/i]: i*z or z*i
Domain coloring HSV: Phase Portrait Modulus
Change the function f(z). Example: 1/z[br][br][b]Remark:[/b] Now you can use the complex constant [b]i[/b]. Example: z*i or i*z.
Other functions to try:[br][list][*](z-1)/(z^2+z+1)[/*][*]exp(1/z)[/*][*]z^3-1[/*][*](1-cos(z))/z^2[/*][*]ln(z)[/*][/list]
Complex functions: Domain colouring with contour lines
Drag the grey point or slider. Change the function f(z). Example: (z-i)/(z+i)
Other functions to try:[br][list][*](z-1)/(z^2+i*z+i)[/*][*]exp(1/z)[/*][*]ln(z)[/*][*]z^3-1[/*][*](1-cos(z))/z^2[/*][/list]
