random numbers
random numbers
You can create a random integer with the commands [br][list][*][b]RandomBetween[ 1, 10 ][br][/b]This command selects an integer between 1 and 10.[/*][*][b]RandomDiscrete[{1, 2, 3, 4, 5}, {1, 4, 4, 4, 1}][/b][br]This command uses two lists. The first one contains the possible numbers. The second list gives each umber a probability. In this example the probability to select one of the numbers 2, 3 and 4 is four times as much as the probality to select 1 or 5.[/*][/list]
shuffled lists
You can use shuffled lists to add or exclude numbers or to ensure that numbers aren't the same.[br][list][*][b]list1 = Shuffle[{-3, -2, -1, -0.5, 0.5, 1, 2, 3}][/b] creates a list of numbers between -3 and 3 from which 0 is excluded and to which -0.5 and 0.5 are added. The umbers are sorted in a random order.[/*][*][b]a = list1(1)[/b] defines a as the first number in the shuffled list.[/*][*][b]b = list1(2)[/b] ensures that a is not equal to b. [br]This definition makes it possible to define two random but unequal numbers whithin a given range and even exclude or add certain values..[/*][/list]
exercises
Try to use random numbers and/or shuffled lists to create numbers following the given conditions.
a random number between 1 and 10.
a random number between 1 and 5 with the probability of the even numbers twice as much as the probability of the odd numbers.
an even number between 1 and 10
an integer between -4 and 4 but not equal to 0 nor to 1
two unequal integers between 1 and 5
a decimal number between 1 and 10 with 1 decimal
Input Box for answering
adding two integers
Next applet shows an exercise in which the sum of two integers is asked. Conditional coloring of the Input Box gives feedback. Then try it yourself, following the given Construction Steps.
Try it yourself...
Construction Steps
[table][tr][td]1[/td][td][/td][td]Type the command [b]a = RandomBetween(1, 10)[/b] in the input bar and create the number [i]a[/i].[/td][/tr][tr][td]2[/td][td][/td][td]Type the command [b]b = RandomBetween(1, 10)[/b] in the input bar and create the number [i]b[/i].[/td][/tr][tr][td]3[/td][td][/td][td]Type the command [b]sol = a + b[/b] in the input bar and create the number [i]sol[/i].[/td][/tr][tr][td]4[/td][td][/td][td]Type the command [b]ans = 0[/b] in the input bar and create the number [i]ans[/i].[/td][/tr][tr][td]5[/td][td][icon]/images/ggb/toolbar/mode_text.png[/icon][/td][td]Select the Text Tool and create the dynamic text a + b. Select a and b in the list of available objects to make the text dynamic.[/td][/tr][tr][td]6[/td][td][icon]/images/ggb/toolbar/mode_textfieldaction.png[/icon][/td][td]Select the Input Box Tool and click in the Graphic to create an Input Box with Caption [b]=[/b] and Linked Object [b]ans = 0[/b]. Confirm with OK.[br][u]Note[/u]: In the properties you can modify the length (in tab Style) and the Textstyle.[/td][/tr][tr][td]7[/td][td][icon]/images/ggb/toolbar/mode_buttonaction.png[/icon][/td][td]Select the Button Tool and click in the Graphic to create a button with label [b]new exercise[/b] and GeoGebra Script [b]UpdateConstruction()[/b].[/td][/tr][/table]
Feedback with conditional colors
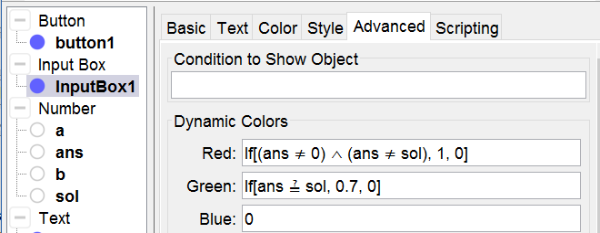
You can color the Input Box red when the answer is wrong and green when it's correct by using dynamic colors. [br][list][*]Rightclick on the Input Box.[/*][*]Select Objects Properties to open the dialog.[br][/*][*]Select the tab Avanced[/*][/list]

[list][*]The syntax for Red: if ans is not equal to 0 neither to sol, the Input Box turns red. If not it doesn't.[/*][*]The syntax for Green: if ans is equal to the solution it turns green. If not it doesn't.[br][u]Note[/u]: By using 0.7 instead of 1 the green is slightly darker.[/*][/list]To prevent the Input Box from turning red when clicking on the button [i]new exercise[/i] we have to add a supplementary command in the script of the button. Rightclick on the button and add in row 2 following command: [b]SetValue(ans,0)[/b], which turns the number ans back to 0.

feedback by a text
feedback in a text
Instead of using dynamic colors of in addition to it, you can show correction feedback in text. Next applet shows a green text [b]Correct![/b] when the given answer is correct an a red text [b]Try again![/b] when it isn't.[br]See in next applet how it works and try adding these texts following the Construction Steps.
Try it yourself...
Construction steps
[table][tr][td]1[/td][td][icon]/images/ggb/toolbar/mode_text.png[/icon][/td][td]Select the Text Tool and create a text [b]Correct[/b]. Color it green.[br]Define the condition to show as [b]ans = sol[/b].[/td][/tr][tr][td]2[/td][td][icon]/images/ggb/toolbar/mode_text.png[/icon][/td][td]Select the Text Tool and create a text [b]Try again[/b]. Color it red.[br]Make it appear if [b]the Input Box isn't empty and ans isn't equal to sol[/b]:[/td][/tr][/table]

Drag the Point
Exercises "Draw..."
We often give students drawing exercises: "Draw a point, draw a line, draw a rectangle...", so why shouldn't we in GeoGebra? Drawing in GeoGebra is no problem, but controlling is. The problem is the syntax in controlling an object that isn't created yet. While working e.g. with polygons you could eventulally do with commands as [b]Execute[{"SetColor[poly"+nr+",red]"}][/b] to give feedback in coloring, for you know in English new created polygons will be called poly1, poly2, etc. But this command will be recognised only by users whose language setting is English, since e.g. in German a new polygon is called Vieleck1, in Italian poli1 etc.[br]An easier alternative is to create a polygon which you have to modify to fit the exercise. In this option language setting is no problem and you don't have to struggle with complicated Execute-syntaxes in scripts.
Drag the point
In next exercise you have to draw a point with given coordinates. Watch how it works and then make it yourself following the given Construction Steps.
Try it yourself...
Construction Steps
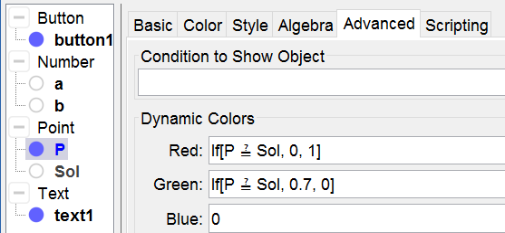
[table][tr][td]1[/td][td][/td][td]Type the command [b]a = RandomBetween[-4, 4][/b] to create a number a.[/td][/tr][tr][td]2[/td][td][/td][td]Type the command [b]b = RandomBetween[-4, 4][/b] to create a number b.[/td][/tr][tr][td]3[/td][td][/td][td]Type the command [b]Sol = (a, b)[/b] to create a point Sol.[/td][/tr][tr][td]4[/td][td][/td][td]Type the command [b]P = (-5, 5)[/b] to create a point P out of the range of the coordinates of Sol.[br]Rightclick on it to set its dynamic colors (see below).[/td][/tr][tr][td]5[/td][td][icon]/images/ggb/toolbar/mode_buttonaction.png[/icon][/td][td]Select the Button Tool and create a button with caption [b]new exercise[/b] and scripting commands[br][b]UpdateConstruction[][/b] to recalculate a and B.[br][b]SetValue[P,(-5,-5)][/b] to set back the point P to its initial position[br][/td][/tr][tr][td]6[/td][td][icon]/images/ggb/toolbar/mode_text.png[/icon][/td][td]Create the dynamic text Drag P so that [b]P =(a, b)[/b] and select a and b in the list of available objects.[/td][/tr][/table][br][u]Hint[/u]: Open the Toggle Style Bar of the Graphics and set the Point capture style to Fixed to Grid.
slope of a first degree function
Points as Check Box
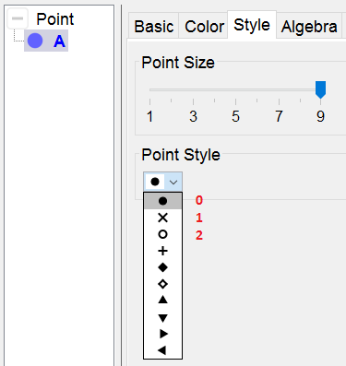
Points are well fitted to be used as Check Boxes since you can define its style and its color in a script.[br]There are 10 different Point Styles, numbered from 0 to 9. We'll use[br][list][*]an empty point [b](Point Style = 2)[/b] for an unchecked option[/*][*]a full point [b](Point Style = 0)[/b] for a checked option[/*][/list]When a checked option, represented by a point A, is correct, we'll color it green, when it's wrong we'll color it red, using the commands [b]SetColor[A, "green"][/b] and [b]SetColor[A, "red"][/b].
slope of a first degree function
The graph of a first degree function kan be ascending, descending or none of both. In next applet you have to select the correct option. See how it works and make it yourself, following the construction steps.
Try it yourself...
Construction Steps
[table][tr][td]1-2[/td][td][/td][td]Create the numbers a and b with the command [b]RandomBetween[-4, 4][/b].[/td][/tr][tr][td]3[/td][td][/td][td]Define a function f as [b]f(x) = Polynomial[a x + b][/b].[br]Note: The command Polynomial[] prevents the equation to be displayed as e.g. 1x + 2.[/td][/tr][tr][td]4-6[/td][td][icon]/images/ggb/toolbar/mode_point.png[/icon][/td][td]Select the [b]Point Tool[/b] and click three times in the Graphics to create the points A, B and C.[/td][/tr][tr][td]7-9[/td][td][icon]/images/ggb/toolbar/mode_text.png[/icon][/td][td]Select the Text Tool and create the texts [b]is ascending[/b], [b]is descending[/b] and [b]none of both[/b].[br]Align these three texts to the points A, B and C.[/td][/tr][tr][td]10[/td][td][/td][td]Type the command [b]ans = 0[/b] to create a variable number ans.[/td][/tr][tr][td]11[/td][td][/td][td]Type the command [b]sol = [/b][b]If [a > 0, 1, If[a < 0, 2, 3]][/b] to define the number sol.[br]The value of sol is defined in a nested condition so that:[br]- if a > 0 sol = 1[br]- if a < 0 sol = 2[br]- if a = 0 sol = 3[/td][/tr][tr][td]12[/td][td][icon]/images/ggb/toolbar/mode_buttonaction.png[/icon][/td][td]Select the [b]Button Tool[/b] and create a button with capition [b]new exercise[/b] and scripting commands[br][b]UpdateConstruction[] [/b] to recalculate the Random numbers[br][b]SetValue[ans,0] [/b] to set the value of ans back to its initial value 0[br][b]SetPointStyle[A, 2] [/b] to uncheck the points A, B and C[br][b]SetPointStyle[B, 2][br]SetPointStyle[C, 2][/b][br][b]SetColor[A, "blue"][/b] to set the color of the points A, B and C to blue[br][b]SetColor[B, "blue"][br]SetColor[C, "blue"][/b][br][/td][/tr][tr][td]13[/td][td][icon]/images/ggb/toolbar/mode_text.png[/icon][/td][td]Select the [b]Text Tool[/b] and type the dynamic text selecting f in the list of available objects.[/td][/tr][/table]
Scrips of the points
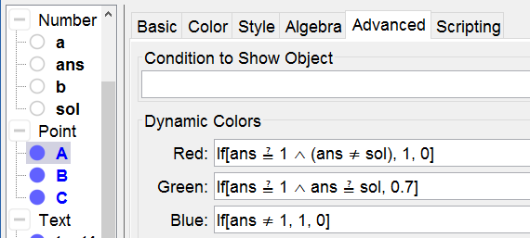
For checking and controlling the answer we add a script to each of the three points:[br][list][*]By clicking on A ans gets the value 1, by clicking on B ans = 2 and by clicking on C ans = 3.[/*][*]When selecting one of the three points, it gets Point Style 0 (= full) the other two must be unchecked getting Point Style 2( = empty) and colored blue.[/*][*]When making a good selection the selected point colors green if wrong it colors red.[/*][/list]Rightclick on the points and type in the Tab On Click of Scripting these scripts:

the answer is controlled by dynamic coloring of the points. Here's shown how to work for point A.[br]Now it's not hard to figure out how to do for B and C (with the corresponding values of ans).
combine graphs and equations
images of graphs
We want to combine the graphs of 4 functions with their equation. First we have to do some preparational work creating the images of the graphs. You can export the Graphics View as a picture (see the [url=https://wiki.geogebra.org/en/Export_Graphics_Dialog]manual[/url]).[br]Read the article in the manual and save the picture of the four following functions on your computer:[br][list][*]f(x) = x²[/*][*]f(x) = x² + 2[/*][*]f(x) = (x + 2)²[/*][*]f(x) = -x²[/*][/list]In the [url=https://wiki.geogebra.org/en/Image_Tool]manual[/url] you can read how to insert pictures in an applet.
drop-down lists
To match the graphs with their equation we can use drop-down lists in which we can select the appropriate answer out of the options A, B, C or D and showing a blank answer as its initial position.[br][list][*]Type the command [b]list1= {"", "A", "B", "C", "D"}[/b][/*][*]Rightclick on the list in the Algebra View to open its Properties.[/*][*]Select the tab [b]Basic[/b], check the option [b]Draw as drop-down list[/b] and type [b]graph[/b] as its Caption.[/*][*]Define [b]ans1= SelectedIndex[list1][/b]. When you select the option A ans will be equal to 2. At its initial position (a blank answer) ans1 will be equal to 1.[/*][/list]
Try it yourself...
Construction Steps
[table][tr][td]1-12[/td][td][icon]/images/ggb/toolbar/mode_image.png[/icon][/td][td]Select the [b]Picture Tool[/b] and insert the pictures of the four graphs.[br]Align them in the Graphics by dragging the defining corners.[br]Hide these defining corner points afterwards.[/td][/tr][tr][td]13-16[/td][td][icon]/images/ggb/toolbar/mode_text.png[/icon][/td][td]Select the [b]Text Tool [/b]and mark the graphs as A, B, C and D.[/td][/tr][tr][td]17-20[/td][td][icon]/images/ggb/toolbar/mode_text.png[/icon][/td][td]Select the [b]Text Tool [/b]and type the four equations of the functions.[/td][/tr][tr][td]21-24[/td][td][/td][td]Define the four lists and draw them as drop-down lists behind the equations.[br][u]Attention[/u]: Make sure list1 is situated behind f[sub]1[/sub] etc.[/td][/tr][tr][td]25-28[/td][td][/td][td]Define the fours answers as: [b]ans1 = SelectedIndex[list1][/b] etc.[/td][/tr][tr][td]29[/td][td][icon]/images/ggb/toolbar/mode_buttonaction.png[/icon][/td][td]Select the Button Tool and create a button with Caption [b]reset[/b] and scripting commands[br][b]SetValue[list1,1][/b] to reset all four drop-down lists to their initial blank position[br][b]SetValue[list2,1][br]SetValue[list3,1][br]SetValue[list4,1][/b][br][/td][/tr][/table]
dynamic colors of the drop-down lists
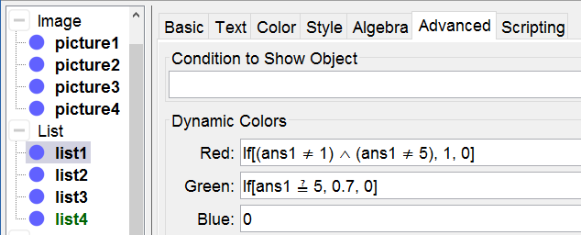
Again we can use dynamic colors to control the selected answers.[br][list][*]f[sub]1[/sub] = x² matches with graph D. [/*][*]The list colors red if the selection is wrong. That's if it isn't blank (ans [math]\ne[/math] 1) and neither D (ans [math]\ne[/math] 5).[br][/*][*]The list colors green if the selection is correct. That's if D is selected (ans = 5).[br][/*][/list]The other lists are colored similarly.
Similar exercises
Numerous exercises can be made in a similar way combining slopes, signs, equations, derivates, graphs, a list of its roots or asymptotes, axes of symmetry...
