Learn GeoGebra Classic

Welcome to [url=https://www.geogebra.org/classic]GeoGebra Classic[/url]! Learn how to use this integrated bundle of math apps for graphing, geometry, 3D, algebra, CAS, data (spreadsheet) and probability. Choose one of the quick and easy tours in the chapters below and get started with the apps.
Table des matières
- First Steps
- Comparison of GeoGebra Math Apps
- Introduction
- Explore the app
- Perspectives and Views
- Tools
- Commands
- Style Bar
- Settings
- Tips and tricks for algebraic input
- Renaming objects
- Inserting static text
- Inserting pictures
- Saving GeoGebra files
- Graphing
- Graphing Perspective
- Functions and coordinates
- Parameters of linear equations
- Quadratic polynomials
- Parameters of a polynomial
- Systems of linear equations
- Graphing derivatives
- Derivation of sine
- Linear inequalities
- Assigning points to coordinates
- Working with sequences
- Visualizing integer addition
- Visualizing multiplication
- Geometry
- Geometry Perspective
- Parallelogram
- Equilateral triangle
- Circumcircle of a triangle
- Regular hexagon
- Exploring symmetry
- Transforming a picture
- Translating pictures
- Rotating polygons
- Triangle inequalities
- Angle sum in a triangle
- Visualizing fractions
- Dimensions of a circle
- 3D Graphics
- 3D Graphics Perspective
- 3D Graphics tools
- Customizing the 3D Graphics View
- Start constructing
- Intersection of a plane and a line
- Distance between two lines
- Rotating a function
- Functions of two variables
- Cutting a cube
- Net of a dodecahedron
- Parallelepiped
- Spherical Coordinates
- Conic sections
- CAS
- CAS Perspective
- CAS tools
- CAS and Graphics View
- Algebraic input in CAS
- CAS commands
- Tips and tricks for CAS input
- Exploring GCD and LCM
- Intersection of polynomials
- Solving a system of equations
- Manipulating equations
- Spreadsheet
- Spreadsheet Perspective
- Spreadsheet tools
- Data input and referring to cells
- Copying cell content
- Recording to spreadsheet
- Spreadsheet tools for data analysis
- One variable analysis
- Two variable regression
- Scatter plot and best fit line
- Chess and grains
- Probability
- Probability Perspective
- Probability Style Bar
- Binomial distribution
- Normal distribution
- Hypergeometric distribution
- Poisson distribution
- Exponential distribution
- Z-test of a mean
- T-test of a mean
- Goodness of fit test
- Advanced
- Animating a construction
- Inserting a check box
- Creating a custom toolbar
- Creating a custom tool
- Inserting dynamic text
- Inserting LaTeX formulas
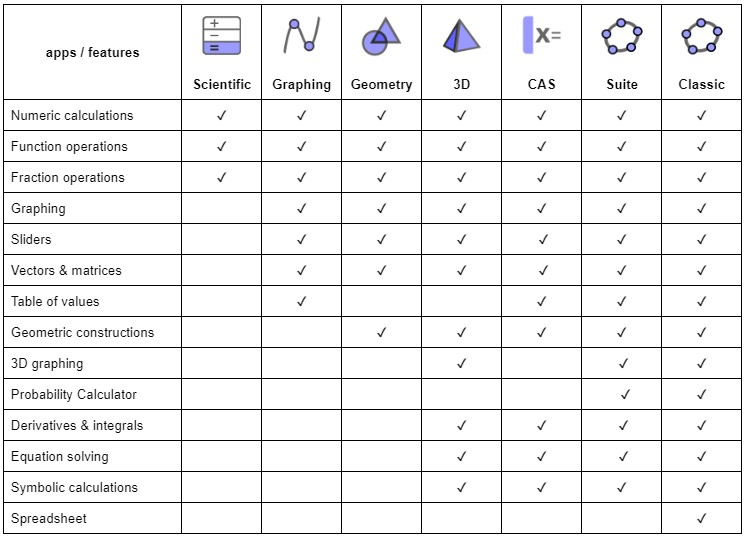
Comparison of GeoGebra Math Apps
With our [i]GeoGebra[/i] math apps you can explore and learn functions, geometry, algebra, statistics and 3D in new and interactive ways.[br][list][*][url=http://www.geogebra.org/scientific]Scientific Calculator[/url][br][/*][*][url=https://www.geogebra.org/graphing]Graphing Calculator[/url][br][/*][*][url=https://www.geogebra.org/geometry]Geometry[/url][br][/*][*][url=https://www.geogebra.org/calculator]Calculator Suite[/url][/*][*][url=https://www.geogebra.org/cas]CAS Calculator[/url][br][/*][*][url=https://www.geogebra.org/3d]3D Calculator[/url][/*][*][url=https://www.geogebra.org/classic]GeoGebra Classic[/url][br][/*][/list]The right app for you is the one that meets your own needs and, if used in tests, fulfills exam regulations of your region. The following table gives an overview of which features are available in which apps.
GeoGebra in Exams
We believe that students benefit from using the exact same GeoGebra app in class, for homework and during tests. This way, they will get the most practice with the app and therefore be able to make the best use of our technology in all situations. That's why we have created our [url=https://www.geogebra.org/m/y3aufmy8]GeoGebra Exam Mode[/url] and added it within each one of our apps. The exam mode locks down mobile devices so students cannot communicate or use any other apps than GeoGebra during a test. This approach has already been field-tested and approved by several ministries of education in several regions. Read more about how to use [url=https://www.geogebra.org/m/y3aufmy8]GeoGebra in exams[/url].[br][br]
Graphing Perspective
The [img]https://geogebra.github.io/docs/manual/en/_images/tutorials/16px-Menu_view_algebra.svg.png[/img] [i]Graphing Perspective[/i] includes the [img]https://geogebra.github.io/docs/manual/en/_images/tutorials/16px-Menu_view_algebra.svg.png[/img] [i]Algebra View[/i] and the [img]https://geogebra.github.io/docs/manual/en/_images/tutorials/16px-Menu_view_graphics.svg.png[/img] [i]Graphics View[/i]. By default, the [img]https://geogebra.github.io/docs/manual/en/_images/tutorials/16px-Stylingbar_graphicsview_show_or_hide_the_axes.svg.png[/img] [i]coordinate axes[/i] are shown and the [i]Graphics View Toolbar[/i] is displayed at the top of the [i]GeoGebra Classic [/i]app[size=100], with the [img]https://geogebra.github.io/docs/manual/en/_images/tutorials/16px-Menu-edit-undo.svg.png[/img] [size=100][size=100][img]https://geogebra.github.io/docs/manual/en/_images/tutorials/16px-Menu-edit-redo.svg.png[/img][/size][/size] [i]Undo / Redo[/i] buttons in the top right corner.[/size]
The Algebra View
In the [img]https://geogebra.github.io/docs/manual/en/_images/tutorials/16px-Menu_view_algebra.svg.png[/img] [i]Algebra View[/i] you can directly enter algebraic expressions using the [i]Input Bar[/i]. After hitting the [i]Enter [/i]key your algebraic input appears in the [img]https://geogebra.github.io/docs/manual/en/_images/tutorials/16px-Menu_view_algebra.svg.png[/img] [i]Algebra View.[br][br][/i][b]Note:[/b] At the same time, the corresponding graphical representation is automatically displayed in the [img]https://geogebra.github.io/docs/manual/en/_images/tutorials/16px-Menu_view_graphics.svg.png[/img] [i]Graphics View[/i].[br][br][b]Example:[/b] The input [math]y=2x+3[/math] gives you the linear equation in the [img]https://geogebra.github.io/docs/manual/en/_images/tutorials/16px-Menu_view_algebra.svg.png[/img] [i]Algebra View[/i] and the corresponding line in the [img]https://geogebra.github.io/docs/manual/en/_images/tutorials/16px-Menu_view_graphics.svg.png[/img] [i]Graphics View[/i].
Task
Get in touch with the [img]https://geogebra.github.io/docs/manual/en/_images/tutorials/16px-Menu_view_algebra.svg.png[/img] [i]Graphing Perspective[/i] by following the instructions below.
Instructions
[table][tr][td][size=100]1.[/size][/td][td][size=100][icon]/images/ggb/toolbar/mode_move.png[/icon][/size][/td][td][size=100]Click into the [i]Input Bar[/i], enter [math]f\left(x\right)=0.5x+1[/math] and press [i]Enter[/i].[br][/size][/td][/tr][tr][td][size=100]2.[/size][/td][td][size=100][icon]/images/ggb/toolbar/mode_move.png[/icon][/size][/td][td][size=100]Activate the [i]Move[/i] tool and select the function in the [img]https://geogebra.github.io/docs/manual/en/_images/tutorials/16px-Menu_view_graphics.svg.png[/img] [i]Graphics View[/i]. Open the [size=100][img]https://geogebra.github.io/docs/manual/en/_images/tutorials/16px-Stylingbar_icon_graphics.svg.png[/img] [i]Style Bar[/i][/size] and select [img width=20,height=20]https://lh6.googleusercontent.com/oKmfISp_VWciZtnxqRxe1WLfkZJdwua5SX2KCWj7IljZrORlh8JU9WuEJlfs1DcFiNys1GuZ-QOBmx72LIBrujP46hFziSTUl4E1vuy1PzvE2Y8ab9FOiwxrRzLoutmTldKfv9aJ[/img] to unfix the function and to be able to drag the function. [br]Explore how the parameters of the function in the [img]https://geogebra.github.io/docs/manual/en/_images/tutorials/16px-Menu_view_algebra.svg.png[/img] [i]Algebra View[/i] change when dragging [i]f(x)[/i].[br][/size][/td][/tr][tr][td][size=100]3.[/size][/td][td][size=100][/size][/td][td][size=100][size=100][size=100]Enter the quadratic function [math]g\left(x\right)=x^2-1[/math] into the [i]Input Bar [/i]and press [i]Enter[/i].[/size][/size][/size][/td][/tr][tr][td][size=100]4.[/size][/td][td][size=100][/size][/td][td][size=100][size=100]Enter [math]Intersect\left(f\left(x\right),g\left(x\right)\right)[/math] into the [i]Input Bar [/i]and press [i]Enter[/i].[/size][/size][/td][/tr][tr][td][size=100][/size][/td][td][size=100][/size][/td][td][size=100][b][/b][size=100][b]Hint:[/b] This command yields the intersection points of the two functions. [br]The points are displayed in the [img]https://geogebra.github.io/docs/manual/en/_images/tutorials/16px-Menu_view_graphics.svg.png[/img] [i]Graphics View[/i] as well as in the [img]https://geogebra.github.io/docs/manual/en/_images/tutorials/16px-Menu_view_algebra.svg.png[/img] [i]Algebra View[/i].[/size][/size][/td][/tr][tr][td][size=100]5.[/size][/td][td][size=100][icon]/images/ggb/toolbar/mode_move.png[/icon][/size][/td][td][size=100][size=100]Select the [i]Move[/i] tool and drag the linear function. [br]How do the [/size][size=100]intersection points change?[br][/size][/size][/td][/tr][/table]
Try it yourself...
Hiding Mathematical Objects in the Algebra View
If you want to hide the algebraic representation of an object in the [img width=16,height=16]https://geogebra.github.io/docs/manual/en/_images/tutorials/16px-Menu_view_algebra.svg.png[/img] [i]Algebra View[/i], you may specify the object as an Auxiliary Object[i].[/i] Open the tab [i]Basic[/i] of the [img width=16,height=16]https://geogebra.github.io/docs/manual/en/_images/tutorials/16px-Menu-options.svg.png[/img] Properties Dialog and check [i]Auxiliary Object[/i].[br][br]By default, [i]Auxiliary Objects[/i] are not shown in the [img width=16,height=16]https://geogebra.github.io/docs/manual/en/_images/tutorials/16px-Menu_view_algebra.svg.png[/img] [i]Algebra View[/i]. You can change this setting by selecting [i]Auxiliary Objects[/i] from the[i] Context Menu [/i](right-click or Mac OS Ctrl-click), or by selecting on the appropriate icon in the [url=https://www.geogebra.org/m/XUv5mXTm#material/a28zyjjq][i]Algebra View Style Bar[/i][/url].[br]
Geometry Perspective
The [img]https://geogebra.github.io/docs/manual/en/_images/tutorials/16px-Perspectives_geometry.svg.png[/img] [i]Geometry Perspective[/i] displays the [img]https://geogebra.github.io/docs/manual/en/_images/tutorials/16px-Menu_view_graphics.svg.png[/img] [i]Graphics View[/i] without the [img]https://geogebra.github.io/docs/manual/en/_images/tutorials/16px-Stylingbar_graphicsview_show_or_hide_the_axes.svg.png[/img] [i]coordinate axes[/i], as well as the [i]Graphics View Toolbar[/i] and the [img]https://geogebra.github.io/docs/manual/en/_images/tutorials/16px-Menu-edit-undo.svg.png[/img] [img]https://geogebra.github.io/docs/manual/en/_images/tutorials/16px-Menu-edit-redo.svg.png[/img] [i]Undo / Redo[/i] buttons in the top right corner.[br]
The Graphics View
The [img]https://geogebra.github.io/docs/manual/en/_images/tutorials/16px-Menu_view_graphics.svg.png[/img] [i]Graphics View[/i] always displays the graphical representation of objects created in [i]GeoGebra[/i]. In addition, the [i]Graphics View Toolbar[/i] is displayed at the top and the [i]Undo / Redo[/i] buttons in the top right corner.[br][br][b]Note:[/b] The [img]https://geogebra.github.io/docs/manual/en/_images/tutorials/16px-Menu_view_graphics.svg.png[/img] [i]Graphics View[/i] is part of almost all [url=https://www.geogebra.org/m/XUv5mXTm#material/ncjbw5zr]Perspectives[/url] and can be customized (e.g. show different kinds of [img]https://geogebra.github.io/docs/manual/en/_images/tutorials/16px-Stylingbar_graphicsview_show_or_hide_the_grid.svg.png[/img] grids and/or [img]https://geogebra.github.io/docs/manual/en/_images/tutorials/16px-Stylingbar_graphicsview_show_or_hide_the_axes.svg.png[/img] coordinate axes).[br][br]Using the [i]Construction[/i] [i]Tools [/i]available in the [i]Graphics View Toolbar[/i] you can create geometric constructions in the [img]https://geogebra.github.io/docs/manual/en/_images/tutorials/16px-Menu_view_graphics.svg.png[/img] [i]Graphics View[/i]. Select any construction [i]Tool [/i]from the [i]Graphics View Toolbar[/i] and read the appearing [i]Tooltip [/i]to find out how to use the selected [i]Tool[/i].[br][br][b]Note:[/b] Any object you create in the [img]https://geogebra.github.io/docs/manual/en/_images/tutorials/16px-Menu_view_graphics.svg.png[/img] [i]Graphics View [/i]also has an algebraic representation in the [img]https://geogebra.github.io/docs/manual/en/_images/tutorials/16px-Menu_view_algebra.svg.png[/img] [i]Algebra View[/i].
Task
Get in touch with the [size=100][img]https://geogebra.github.io/docs/manual/en/_images/tutorials/16px-Perspectives_geometry.svg.png[/img][/size] [i]Geometry Perspective[/i] by following the instructions.
Instructions
[table][tr][td][size=100]1.[/size][/td][td][size=100][icon]https://www.geogebra.org/images/ggb/toolbar/mode_circle2.png[/icon][/size][/td][td][size=100]Select the [i]Circle with Center through Point[/i] tool and click two times in the [img]https://geogebra.github.io/docs/manual/en/_images/tutorials/16px-Perspectives_geometry.svg.png[/img] [i]Graphics View[/i].[br][/size][/td][/tr][tr][td][size=100]2.[/size][/td][td][size=100][icon]https://www.geogebra.org/images/ggb/toolbar/mode_move.png[/icon][/size][/td][td][size=100]Select the [i]Move[/i] tool and drag point [i]B[/i] on the circle.[br]Explore how the size of the circle changes.[br][/size][/td][/tr][tr][td][size=100]3.[/size][/td][td][size=100][img]https://geogebra.github.io/docs/manual/en/_images/tutorials/32px-Stylingbar_icon_graphics.svg.png[/img][/size][/td][td][size=100]Open the [i]Graphics View Style Bar[/i] by clicking on the symbol in the top right corner.[br][/size][/td][/tr][tr][td][size=100]4.[/size][/td][td][size=100][icon]https://geogebra.github.io/docs/manual/en/_images/tutorials/120px-Stylingbar_graphicsview_show_or_hide_the_axes.svg.png[/icon][/size][/td][td][size=100]Show the [i]coordinate axes[/i] by clicking on this icon.[br][/size][/td][/tr][tr][td][size=100]5. [br][/size][/td][td][size=100][icon]https://geogebra.github.io/docs/manual/en/_images/tutorials/120px-Stylingbar_graphicsview_show_or_hide_the_grid.svg.png[/icon][/size][/td][td][size=100]Show the grid by clicking on the grid in the [img]https://geogebra.github.io/docs/manual/en/_images/tutorials/16px-Stylingbar_icon_graphics.svg.png[/img] [i]Style Bar[/i].[br][/size][/td][/tr][tr][td][size=100]6.[br][/size][/td][td][size=100][icon]https://www.geogebra.org/images/ggb/toolbar/mode_polygon.png[/icon][br][/size][/td][td][size=100]Draw a quadrilateral by clicking four times into the [img]https://geogebra.github.io/docs/manual/en/_images/tutorials/16px-Perspectives_geometry.svg.png[/img] [i]Graphics View[/i].[url=http://www.dict.cc/englisch-deutsch/quadrilateral.html][/url] Close the quadrilateral by clicking on the first point again.[br][/size][/td][/tr][/table]
Try it yourself...
Displaying a second Graphics View
A second [img]https://geogebra.github.io/docs/manual/en/_images/tutorials/16px-Menu_view_graphics.svg.png[/img] [i]Graphics View[/i] can be shown using the [img]https://geogebra.github.io/docs/manual/en/_images/tutorials/16px-Menu-view.svg.png[/img] [i]View Menu of the app's [img]https://geogebra.github.io/docs/manual/en/_images/tutorials/16px-Menu-button-open-menu.svg.png[/img] menu[/i]. If two [img]https://geogebra.github.io/docs/manual/en/_images/tutorials/16px-Menu_view_graphics.svg.png[/img] [i]Graphics Views[/i] are visible, one of them is always active (either it's being worked with and it has bold caption, or it is the last [i]View [/i]that has been worked with). All visible objects created by [i][url=https://wiki.geogebra.org/en/Commands]Commands[/url][/i] appear in the active [img]https://geogebra.github.io/docs/manual/en/_images/tutorials/16px-Menu_view_graphics.svg.png[/img] [i]Graphics View[/i]. For each object you can specify in which [img]https://geogebra.github.io/docs/manual/en/_images/tutorials/16px-Menu_view_graphics.svg.png[/img] [i]Graphic View(s)[/i] it will be visible using the [i]Advanced[/i] tab of the [img]https://geogebra.github.io/docs/manual/en/_images/tutorials/16px-Menu-options.svg.png[/img] [i][url=https://www.geogebra.org/m/XUv5mXTm#material/ncrtzrq5]Settings[/url][/i].
Modifying Mathematical Objects
[b]The [img width=26,height=26]https://geogebra.github.io/docs/manual/en/_images/tutorials/26px-Mode_move.svg.png[/img] Move Tool[/b][br]After activating the [img width=20,height=20]https://geogebra.github.io/docs/manual/en/_images/tutorials/20px-Mode_move.svg.png[/img][i]Move Tool [/i]you are able to move objects in the [img width=16,height=16]https://geogebra.github.io/docs/manual/en/_images/tutorials/16px-Menu_view_graphics.svg.png[/img] [i]Graphics View[/i] by dragging them with the mouse or with a touch pad. [br][br][b]Note:[/b] At the same time, their algebraic representations are dynamically updated in the [img width=16,height=16]https://geogebra.github.io/docs/manual/en/_images/tutorials/16px-Menu_view_algebra.svg.png[/img] [i][url=https://www.geogebra.org/m/XUv5mXTm#material/ncjbw5zr]Algebra View[/url][/i].[br][br][br][br][b]Copy & Paste[/b][br]Via Keybord Shortcut Ctrl + C and Ctrl + V (Mac OS:Ctrl + C and Ctrl + V) you can [i]Copy and Paste[/i] selected objects (except if they depend on the coordinate axes) into either the same or into another window. [br][br][b]Note:[/b] [i]Copy and Paste[/i] will copy every ancestor of the selected objects but makes the non-selected objects invisible.[br][b]Example:[/b] If you copy objects depending on sliders into a new window, it will copy the slider (invisible) into the window, too.[br][br]The pasted object is fixed when you click on the [img width=16,height=16]https://geogebra.github.io/docs/manual/en/_images/tutorials/16px-Menu_view_graphics.svg.png[/img] [i]Graphics View[/i]. If the copied object depends on at least one point then it can snap onto existing points when pasted (but only the point following the mouse pointer will do this).
Hiding Mathematical Objects in the Graphics View
You may hide objects in the [img width=16,height=16]https://geogebra.github.io/docs/manual/en/_images/tutorials/16px-Menu_view_graphics.svg.png[/img] [i]Graphics View[/i] by either[br][br][list][*] using the [img width=18,height=18]https://geogebra.github.io/docs/manual/en/_images/tutorials/18px-Mode_showhideobject.svg.png[/img][i] Show/Hide Object Tool[/i][/*][*] opening the Context Menu and unchecking [img width=18,height=18]https://geogebra.github.io/docs/manual/en/_images/tutorials/18px-Mode_showhideobject.svg.png[/img] [i]Show Object[/i][/*][/list]
3D Graphics Perspective
The [img]https://geogebra.github.io/docs/manual/en/_images/tutorials/16px-Perspectives_algebra_3Dgraphics.svg.png[/img] [i]3D Graphics Perspective[/i] includes the [img]https://geogebra.github.io/docs/manual/en/_images/tutorials/16px-Perspectives_algebra_3Dgraphics.svg.png[/img] [i]3D Graphics View[/i] and the [img]https://geogebra.github.io/docs/manual/en/_images/tutorials/16px-Menu_view_algebra.svg.png[/img] [i]Algebra View[/i]. By default, the [img]https://geogebra.github.io/docs/manual/en/_images/tutorials/16px-Stylingbar_graphicsview_show_or_hide_the_axes.svg.png[/img] [i]coordinate axes[/i] and the [i]xOy-plane[/i] are shown in the [img]https://geogebra.github.io/docs/manual/en/_images/tutorials/16px-Perspectives_algebra_3Dgraphics.svg.png[/img] [i]3D Graphics View[/i]. Furthermore, the [i]3D Graphics View Toolbar[/i] and the [img]https://geogebra.github.io/docs/manual/en/_images/tutorials/16px-Menu-edit-undo.svg.png[/img] [img]https://geogebra.github.io/docs/manual/en/_images/tutorials/16px-Menu-edit-redo.svg.png[/img] [i]Undo / Redo[/i] buttons in the top right corner are displayed. [br]
The 3D Graphics View
Using the construction Tools available in the [i]3D Graphics View Toolbar[/i] you can create geometric constructions in the [img]https://geogebra.github.io/docs/manual/en/_images/tutorials/16px-Perspectives_algebra_3Dgraphics.svg.png[/img] [i]3D Graphics View[/i]. Select any construction [i]Tool [/i]from the [i]3D Graphics View Toolbar[/i] and read the appearing [i]Tooltip[/i] to find out how to use the selected Tool.[br][br][b]Note:[/b] Any object you create in the [img]https://geogebra.github.io/docs/manual/en/_images/tutorials/16px-Perspectives_algebra_3Dgraphics.svg.png[/img] [i]3D Graphics View[/i] also has an algebraic representation in the [img]https://geogebra.github.io/docs/manual/en/_images/tutorials/16px-Menu_view_algebra.svg.png[/img] [i]Algebra View[/i].[br][br][b]Example[/b][br]Select the [img]https://geogebra.github.io/docs/manual/en/_images/tutorials/16px-Mode_sphere2.svg.png[/img] [i]Sphere with Center through Point[/i] tool and click twice in the [img]https://geogebra.github.io/docs/manual/en/_images/tutorials/16px-Perspectives_algebra_3Dgraphics.svg.png[/img] [i]3D Graphics View[/i]. The first click creates the center point while the second click creates a sphere and a point on the sphere.[br]
Task
Get in touch with the [size=100][img]https://geogebra.github.io/docs/manual/en/_images/tutorials/16px-Perspectives_algebra_3Dgraphics.svg.png[/img] [/size][i]3D Graphics Perspective[/i] by following the Instructions below.
Instructions
[table][tr][td][size=100]1.[/size][/td][td][size=100][icon]/images/ggb/toolbar/mode_cube.png[/icon][/size][/td][td][size=100]Select the [i]Cube[/i] tool from the Toolbox of solids and click twice in the [img]https://geogebra.github.io/docs/manual/en/_images/tutorials/16px-Perspectives_algebra_3Dgraphics.svg.png[/img] [i]3D[/i][i] Graphics View[/i] to create a cube.[br][/size][/td][/tr][tr][td][size=100]2.[/size][/td][td][size=100][icon]/images/ggb/toolbar/mode_move.png[/icon][/size][/td][td][size=100]Select the [i]Move [/i]tool and change the position of the points and the size of the cube by dragging them with the pointer. [/size][/td][/tr][tr][td][size=100][br][/size][/td][td][size=100][br][/size][/td][td][size=100][b]Hint:[/b] By clicking on a point you can switch between moving the point parallel to the [i]x[/i]-[i]y[/i]-plane or parallel to the [i]z[/i]-axis.[/size][/td][/tr][tr][td][size=100]3.[br][/size][/td][td][size=100][img]https://geogebra.github.io/docs/manual/en/_images/tutorials/32px-Stylingbar_icon_graphics3D.svg.png[/img][/size][/td][td][size=100]Open the [i]3D Graphics View Style Bar[/i] by clicking the button in the top right corner.[br][/size][/td][/tr][tr][td][size=100]4.[br][/size][/td][td][size=100][icon]https://geogebra.github.io/docs/manual/en/_images/tutorials/120px-Menu-view.svg.png[/icon][br][/size][/td][td][size=100]Adjust the [i]View Direction[/i] by clicking on this tool in the[size=100] [img]https://geogebra.github.io/docs/manual/en/_images/tutorials/16px-Stylingbar_icon_graphics3D.svg.png[/img] [i]3D Graphics View Style Bar[/i][/size]. Choose the view towards the [i]xOy[/i]-plane [size=100][img]https://geogebra.github.io/docs/manual/en/_images/tutorials/16px-Stylingbar_graphics3D_view_xy.svg.png[/img][/size].[br][/size][/td][/tr][tr][td][size=100]5.[br][/size][/td][td][size=100][icon]https://geogebra.github.io/docs/manual/en/_images/tutorials/120px-Stylingbar_graphics3D_standardview_rotate.svg.png[/icon][br][/size][/td][td][size=100]Rotate the [img]https://geogebra.github.io/docs/manual/en/_images/tutorials/16px-Perspectives_algebra_3Dgraphics.svg.png[/img] [i]3D Graphics View[/i] back to default view.[br][/size][/td][/tr][tr][td][size=100]6[br][/size][/td][td][size=100][icon]https://www.geogebra.org/images/ggb/toolbar/mode_rotateview.png[/icon][br][/size][/td][td][size=100]Select the [i]Rotate 3D Graphics View[/i] tool and drag the background of the [img]https://geogebra.github.io/docs/manual/en/_images/tutorials/16px-Perspectives_algebra_3Dgraphics.svg.png[/img] [i]3D Graphics View[/i] with your pointing device. [/size][size=100][br][/size][/td][/tr][tr][td][size=100][br][/size][/td][td][size=100][br][/size][/td][td][size=100][b]Hint:[/b] Alternatively you can right-drag the background of the [size=100][img]https://geogebra.github.io/docs/manual/en/_images/tutorials/16px-Perspectives_algebra_3Dgraphics.svg.png[/img][/size] [i]3D Graphics View[/i] to rotate the coordinate system.[br][/size][/td][/tr][/table]
Try it yourself...
CAS Perspective
The [img]https://geogebra.github.io/docs/manual/en/_images/tutorials/16px-Menu_view_cas.svg.png[/img] [i]CAS Perspective[/i] includes the [img]https://geogebra.github.io/docs/manual/en/_images/tutorials/16px-Menu_view_cas.svg.png[/img] [i]CAS View[/i] and the [img]https://geogebra.github.io/docs/manual/en/_images/tutorials/16px-Menu_view_graphics.svg.png[/img] [i]Graphics View.[/i] By default, the [img]https://geogebra.github.io/docs/manual/en/_images/tutorials/16px-Stylingbar_graphicsview_show_or_hide_the_axes.svg.png[/img] [i]coordinate axes[/i] are shown in the [img]https://geogebra.github.io/docs/manual/en/_images/tutorials/16px-Menu_view_graphics.svg.png[/img] [i]Graphics View[/i]. Depending on which of these [i]Views[/i] is activated, either the [i]Graphics View Toolbar[/i] or the [i]CAS View Toolbar[/i] are shown at the top of the app[size=100], with the [img]https://geogebra.github.io/docs/manual/en/_images/tutorials/16px-Menu-edit-undo.svg.png[/img] [img]https://geogebra.github.io/docs/manual/en/_images/tutorials/16px-Menu-edit-redo.svg.png[/img][size=100] [/size][i]Undo / Redo[/i] buttons in the top right corner.[/size]
The CAS View
[size=100]The [img]https://geogebra.github.io/docs/manual/en/_images/tutorials/16px-Menu_view_cas.svg.png[/img] [i]CAS View[/i] allows you to use GeoGebra's CAS (Computer Algebra System) for symbolic computations. It consists of cells with an[i] Input Bar[/i] at the top and the output displayd below it. You can use this [i]Input Bar [/i]the same way as the normal [i]Algebra View Input Bar[/i], with the following differences:[br][br][/size][list][*][size=100]You can use variables that were not assigned any value.[br][b]Example:[/b] Enter [code](a+b)^2[/code] and select the [icon]https://www.geogebra.org/images/ggb/toolbar/mode_expand.png[/icon] [i]Expand [/i]tool. You will get the output [i]a²+2ab+b²[/i].[br][br][/size][/*][*][size=100]Equations are entered using an equal sign [code]=[/code] (e.g. [code]y = 2*x[/code]), while the input [code]:=[/code] indicates an assignment (e.g. [code]f(x) := 2*x[/code]). [br][b]Note[/b]: This means that the input [code]a = 2[/code] will not assign value [i]2[/i] to the variable [i]a[/i]. [br][br][/size][/*][*][size=100]Multiplication needs to be marked explicitly using an asterisk [code]*[/code] or a space between the factors.[br][/size][/*][/list][size=100][br][b]Note:[/b] The [img]https://geogebra.github.io/docs/manual/en/_images/tutorials/16px-Menu_view_cas.svg.png[/img] CAS View offers a selection of keyboard shortcuts that help you to evaluate or check your input, as well as to reuse previous input or output in a new row[/size].
Task
Get in touch with the [img]https://geogebra.github.io/docs/manual/en/_images/tutorials/16px-Menu_view_cas.svg.png[/img] [i]CAS Perspective[/i] by following the instructions below.
Instructions
[table][tr][td][size=100]1.[/size][/td][td][size=100][icon]https://geogebra.github.io/docs/manual/en/_images/tutorials/32px-Menu_view_cas.svg.png[/icon][/size][/td][td][size=100]Enter [code](x - 2) (x + 1)[/code] into the [i]Input Bar[/i] of the [img]https://geogebra.github.io/docs/manual/en/_images/tutorials/16px-Menu_view_cas.svg.png[/img] [i]CAS View [/i]and try out the different evaluation options:[/size][/td][/tr][tr][td][size=100]2.[/size][/td][td][size=100][icon]https://www.geogebra.org/images/ggb/toolbar/mode_evaluate.png[/icon][/size][/td][td][size=100]Evaluate your input using the [i]Symbolic Evaluation [/i]tool.[br][b]Note:[/b] Your expression is simplified and displayed as [code]x² - x - 2 [/code]in the output display.[/size][/td][/tr][tr][td][size=100]4.[/size][/td][td][size=100][icon]/images/ggb/toolbar/mode_keepinput.png[/icon][/size][/td][td][size=100]Keep your input using the [i]Keep Input[/i] tool.[br][b]Note:[/b] Your expression is not changed and will be displayed as[code] (x - 2) (x + 1) [/code]in the output display.[br][/size][/td][/tr][tr][td][size=100]5.[/size][/td][td][size=100][icon]/images/ggb/toolbar/mode_keepinput.png[/icon][/size][/td][td][size=100]Create a quadratic polynomial by entering f(x):= x^2 – 3/2 * x + 2 into the first row and select the [i]Keep Input[/i] tool instead of pressing the [i]Enter[/i] key.[/size][/td][/tr][tr][td][size=100]6.[/size][/td][td][size=100][/size][/td][td][size=100][b]Note:[/b] If you want your entered expression not to be changed in any way, choose the tool before entering it.[/size][/td][/tr][tr][td][size=100]7.[/size][/td][td][size=100][icon]/images/ggb/toolbar/mode_factor.png[/icon][/size][/td][td][size=100]Enter f(x) into the second row and select the [i]Factor[/i] tool to find the factors of the function.[/size][/td][/tr][tr][td][size=100]8.[/size][/td][td][size=100][icon]/images/ggb/toolbar/mode_derivative.png[/icon][/size][/td][td][size=100]Enter f(x) into the third row and select the [i]Derivative[/i] tool to calculate the derivative of the function.[/size][/td][/tr][tr][td][size=100]9.[/size][/td][td][size=100][icon]https://www.geogebra.org/images/ggb/toolbar/mode_showhideobject.png[/icon][br][/size][/td][td][size=100][b]Hint:[/b] You can display the function in the [img]https://geogebra.github.io/docs/manual/en/_images/tutorials/16px-Menu_view_graphics.svg.png[/img] [i]Graphics View[/i] by clicking on the [i]Visibility [/i]button below the corresponding row number in the [img]https://geogebra.github.io/docs/manual/en/_images/tutorials/16px-Menu_view_cas.svg.png[/img] [i]CAS View[/i].[br][/size][/td][/tr][/table]
Try it yourself...
Spreadsheet Perspective
The [img]https://geogebra.github.io/docs/manual/en/_images/tutorials/16px-Menu_view_spreadsheet.svg.png[/img] [i]Spreadsheet Perspective[/i] includes the [img]https://geogebra.github.io/docs/manual/en/_images/tutorials/16px-Menu_view_spreadsheet.svg.png[/img] [i]Spreadsheet View[/i] and the [img]https://geogebra.github.io/docs/manual/en/_images/tutorials/16px-Menu_view_graphics.svg.png[/img] [url=https://www.geogebra.org/m/XUv5mXTm#material/xdjnca5y][i]Graphics View[/i][/url]. By default, the[br] [img]https://geogebra.github.io/docs/manual/en/_images/tutorials/16px-Stylingbar_graphicsview_show_or_hide_the_axes.svg.png[/img] [i]coordinate axes[/i] are shown in the [img]https://geogebra.github.io/docs/manual/en/_images/tutorials/16px-Menu_view_graphics.svg.png[/img] [i]Graphics View[/i]. [br][br][b]Note:[/b] Depending on which of these [i]Views[/i] is activated, either the [i]Graphics View Toolbar[/i] or the [i]Spreadsheet View Toolbar[/i] are shown and the [img]https://geogebra.github.io/docs/manual/en/_images/tutorials/16px-Menu-edit-undo.svg.png[/img] [img]https://geogebra.github.io/docs/manual/en/_images/tutorials/16px-Menu-edit-redo.svg.png[/img] [i]Undo / Redo[/i] buttons are in the top right corner.
The Spreadsheet View
The [img]https://geogebra.github.io/docs/manual/en/_images/tutorials/16px-Menu_view_spreadsheet.svg.png[/img] [i]Spreadsheet View[/i] is an interactive spreadsheet connected with some of the other [i]Views [/i]of GeoGebra (e.g. the [br][img]https://geogebra.github.io/docs/manual/en/_images/tutorials/16px-Menu_view_graphics.svg.png[/img] [i]Graphics View[/i]). Every cell has a specific name, that allows you to directly address each one.[br][b]Example:[/b] The first cell in column [i]A[/i] is named [i]A1[/i].[br][br][b]Note:[/b] These cell names can be used in expressions and commands to address the content of the corresponding cell.[br][br]In the [img]https://geogebra.github.io/docs/manual/en/_images/tutorials/16px-Menu_view_spreadsheet.svg.png[/img] Spreadsheet cells you can enter not only numbers, but all types of general and geometrical objects that are supported by [i]GeoGebra [/i](e. g., coordinates of points, functions, commands).[br][br][b]Note:[/b] If you copy content from one cell to another, by default all references are changed accordingly to the target position.
Task
Get in touch with the [img]https://geogebra.github.io/docs/manual/en/_images/tutorials/16px-Menu_view_spreadsheet.svg.png[/img] [i]Spreadsheet Perspective[/i] by following the instructions below.
Instructions
[table][tr][td][size=100]1.[/size][/td][td][size=100][icon]https://geogebra.github.io/docs/manual/en/_images/tutorials/100px-Menu_view_spreadsheet.svg.png[/icon][/size][/td][td][size=100]In the [i]Spreadsheet View[/i], enter the following data values into the cells of column [i]A[/i]: [i]A1: [code]1 [/code][/i][i]A2: [/i]2 [i][i] [/i][br][/i][/size][/td][/tr][tr][td][size=100][br][/size][/td][td][size=100][br][/size][/td][td][size=100][b]Hint:[/b] Always evaluate your input by hitting the [i]Enter[/i] key.[br][/size][/td][/tr][tr][td][size=100]2.[/size][/td][td][size=100][icon]https://geogebra.github.io/docs/manual/en/_images/tutorials/100px-Menu_view_spreadsheet.svg.png[/icon][/size][/td][td][size=100]Relative copy the content of cells [i]A1[/i] and A[i]2[/i] to the cells [i]A3[/i] to [i]A6[/i].[/size][/td][/tr][tr][td][br][/td][td][size=100][/size][/td][td][size=100][b]Hint:[/b] Select cells [i]A1[/i] and [i]A2[/i]. Drag the right lower corner of the highlighted cells down to cell [i]A6[/i] to continue the number sequence.[br][/size][/td][/tr][tr][td][size=100]3.[/size][/td][td][size=100][icon]https://geogebra.github.io/docs/manual/en/_images/tutorials/100px-Menu_view_spreadsheet.svg.png[/icon][/size][/td][td][size=100]Enter the following data values into the cells [i]B1[/i] to [i]B6[/i]: [code]2[/code], [code]1[/code], [code]2[/code], [code]3[/code], [code]5[/code], [code]4[/code] [br][/size][/td][/tr][tr][td][size=100]4.[/size][/td][td][size=100][icon]https://www.geogebra.org/images/ggb/toolbar/mode_createlistofpoints.png[/icon][/size][/td][td][size=100]Highlight all cells that contain any content, and select the [i]List of Points[/i] tool. In the appearing dialog click [i]Create[/i]. [br][/size][/td][/tr][tr][td][size=100][/size][/td][td][size=100][/size][/td][td][size=100][b]Hint:[/b] Your cell entries are now used to create points in the [img]https://geogebra.github.io/docs/manual/en/_images/tutorials/16px-Menu_view_graphics.svg.png[/img] [i]Graphics View[/i], using the values in column [i]A[/i] for their [i]x[/i]-coordinates, while the values of column [i]B[/i] determine the [i]y[/i]-coordinates. [br][/size][/td][/tr][/table]
Try in yourself...
Probability Perspective
The [img]https://geogebra.github.io/docs/manual/en/_images/tutorials/16px-Menu_view_probability.svg.png[/img] [i]Probability Perspective[/i] shows the [img]https://geogebra.github.io/docs/manual/en/_images/tutorials/16px-Menu_view_probability.svg.png[/img] [i]Probability Calculator[/i], which allows you to easily calculate and graph probability distributions, as well as to conduct statistical tests.
The views of the Probability Calculator
[size=100]The [i]Distribution[/i] [i]View[/i] of the [img]https://geogebra.github.io/docs/manual/en/_images/tutorials/16px-Menu_view_probability.svg.png[/img] [i]Probability Calculator[/i] allows you to graph a variety of probability distributions. [br]Just select the distribution you want to work with from the list available in the drop down menu (e.g. Normal, Binomial) and [i]GeoGebra [/i]will graph it for you. Then, you can adjust the parameters of the distribution in the adjacent text boxes. [/size][br][br]The [i]Statistics View [/i]in the[i] [img]https://geogebra.github.io/docs/manual/en/_images/tutorials/16px-Menu_view_probability.svg.png[/img] Probability Calculator[/i] [size=100]allows you to conduct a variety of statistical tests. Just select the test you want to work with from the list available in the drop down menu (e.g. [i]Z Test of a Mean[/i]) and specify your [i]Null Hypothesis[/i], as well as your [i]Alternative Hypothesis[/i]. Then, adjust the parameters of your test in the provided text boxes and [i]GeoGebra [/i]will automatically provide the results of your statistical test.[/size]
Task
Get in touch with the features of the [i]Distribution View[/i] of the [img]https://geogebra.github.io/docs/manual/en/_images/tutorials/16px-Menu_view_probability.svg.png[/img][i]Probability Calculator[/i].
Instructions
[table][tr][td][img]https://geogebra.github.io/docs/manual/en/_images/tutorials/24px-Interval.svg.png[/img][/td][td]Calculate the probability P([i]a[/i] [math]\le [/math]X [math]\le[/math] [i]b[/i]) of a distribution. [br][b]Note:[/b] You can adjust the interval limits [i]a[/i] and [i]b[/i] by either replacing their values in the formula, or by dragging them in the graph.[br][/td][/tr][tr][td][img]https://geogebra.github.io/docs/manual/en/_images/tutorials/24px-Left_sided.svg.png[/img][/td][td]Calculate the probability P(X [math]\le[/math][i] x[/i]) of a left sided distribution. [/td][/tr][tr][td][img]https://geogebra.github.io/docs/manual/en/_images/tutorials/24px-Right_sided.svg.png[/img][/td][br][td]Calculate the probability P([i]x [/i][math]\le[/math] X) of a right sided distribution. [/td][/tr][br][tr][td][img]https://geogebra.github.io/docs/manual/en/_images/tutorials/24px-Two_tailed.svg.png[/img][/td][br][td]Calculate the probability P([i]X[/i] [math]\le[/math] [i]x[/i]) + P([i]X[/i] [math]\ge[/math] [i]x[/i]) of a two tailed distribution. [/td][/tr][tr][td][img]https://geogebra.github.io/docs/manual/en/_images/tutorials/Cumulative.png[/img][/td][td]Toggle between the graphs of the [i]probability density function[/i] and the [i]cumulative distribution function[/i].[br][br][/td][/tr][/table]
Try it yourself...
Task
Get in touch with the [i]Statistics View[/i] of the [img]https://geogebra.github.io/docs/manual/en/_images/tutorials/16px-Menu_view_probability.svg.png[/img] [i]Probability Calculator[/i].
Instructions
[table][tr][td][size=100]1.[br][/size][/td][td][size=100]Open the [i]Statistics View[/i].[br][/size][/td][/tr][tr][td][size=100]2[br][/size][/td][td][size=100]Choose a preferred test from the drop-down list (e.g. [i]Z Test of a Mean[/i]).[br][/size][/td][/tr][tr][td][size=100]3.[br][/size][/td][td][size=100]Enter values into the input fields.[br][/size][/td][/tr][tr][td][size=100][br][/size][/td][td][b]Hint:[/b] [i]GeoGebra [/i]will automatically provide the results of the statistical test.[br][/td][/tr][/table]
Try it yourself...
Animating a construction
[i]GeoGebra [/i]offers the possibility to animate sliders (numbers, angles) and points on paths (segment, line, function, curve, etc.). While an animation is running, [i]GeoGebra [/i]remains fully functional. This allows you to make changes to your construction while the animation is playing.
Instructions
[table][tr][td]1.[br][/td][td][/td][td]Right-click (MacOS: [i]Ctrl-click[/i]) on the blue slider[i][/i] and choose [i]Animation[/i] from the appearing context menu.[br][b]Hint:[/b] An [i]Animation[/i] button appears in the lower left corner of the [img]https://geogebra.github.io/docs/manual/en/_images/tutorials/16px-Menu_view_graphics.svg.png[/img] [i]Graphics View[/i]. It allows you to either [img]https://geogebra.github.io/docs/manual/en/_images/tutorials/16px-Nav_pause_circle.svg.png[/img] pause or [img]https://geogebra.github.io/docs/manual/en/_images/tutorials/16px-Nav_play_circle.svg.png[/img] continue an animation.[/td][/tr][tr][td]2.[br][/td][td][/td][td]Right-click (MacOS: [i]Ctrl-click[/i]) on the red slider and choose [i]Animation[/i] from the appearing context menu.[br][b]Hint:[/b] To stop the animation of this slider, you can uncheck [i]Animation[/i] in the context menu.[/td][/tr][tr][td]3.[br][/td][td][icon]https://geogebra.github.io/docs/manual/en/_images/tutorials/32px-Menu-options.svg.png[/icon][/td][td]Open the [i]Settings[/i] for both sliders and choose tab [i]Slider[/i]. There you can change the behavior of the animation (see details below). Try out different settings for the sliders and determine the impact of the animation on the result [i]r[/i].[br][br][/td][/tr][/table]
Try it yourself...
Animation settings
In the [img]https://geogebra.github.io/docs/manual/en/_images/tutorials/16px-Menu-options.svg.png[/img] [i]Settings[/i] you can change the behavior of your animation:[br][br][b]Speed[/b]: A speed of 1 means that the animation takes about 10 seconds to run through the slider interval once.[br][br][b]Repeat[/b]:[br]⇔ Oscillating[br]The animation cycle alternates between Decreasing and Increasing.[br]⇒ Increasing[br]The slider value is always increasing. After reaching the maximum value of the slider, it jumps back to the minimum value and continues the animation.[br]⇐ Decreasing[br]The slider value is always decreasing. After reaching the minimum value of the slider, it jumps back to the maximum value and continues the animation.[br]⇒ Increasing (Once)[br]The slider value is increasing. After reaching the maximum value of the slider, the animation stops.