Edited-The Physics of Motion - images for the eye & mind

This is a series of applets drawn from the website mathMINDhabits [sites.google.com/site/mathmindhabits]. These applets are designed for teachers of physics who want to deepen their understanding of the physics they teach and that their students are expected to learn. Ideally, they will help teachers to better pose stimulating and engaging questions to their students. In trying to understand the nature of motion we are confronted with the problem of reconciling two profoundly different representations of motion. One representation is the path (trajectory: f(x,y,z)=c ) taken by the object in motion as it moves in three dimensional space. The eye perceives that path and the brain "records" it. Unfortunately, the representation of the path traversed is inadequate for understanding the motion - it does not tell us where the object was at any given time nor does it tell us how fast the object was moving at any given time. We need to complement the representation of the motion by a trajectory with images that supply the missing information, i.e. graphs of position and velocity as function(s) of time, i.e. [x(t), y(t), z(t), x'(t), y'(t), z'(t) ]. These images are not images that our eyes ever perceive - they are, however, needed images for the mind's eye. Taken together, the images for the eye and the images for the mind's eye of physics address the question of "how does it move?" - they do not address the question of "why does it move?". This distinction between description and explanation is an important one and one that teachers would do well to get their students to think about. Many of us have observed youngsters interpreting a rising line in a distance-time graph as "the girl climbed the hill" and a descending line on the same graph as "the girl came down the hill". College students often confuse the parabolic trajectory of a thrown football [an image for the eye] with the parabolic form of the graph of the football's height as a function of time [an image for the mind's eye]. The applets in this collection all deal with motion and are an attempt to help the user to become nimble is moving between images for the eye and images for the mind's eye.
Table of Contents
- Projectiles, collisions & all that
- Digital handball
- The Princess and the Key
- Baton twirl
- Monkey drop
- 'Monkey drop' in 3 frames of reference
- monkey drop - space time diagram
- Projectile w/ air resistance
- Projectile in parameter space
- Football & Handball in Parameter Space
- Newton & Aristotle - two ideas about motion
- Oscillators
- forced damped oscillator
- coupled oscillators - normal modes
- Lissajous - oscillatory motion in two dimensions
- Two dimensional oscillatory motion in space-time
- Push Me - Pull You
- Planets & orbits
- Two Planets & A Sun - A Digital Triptych
- planetary orbits in two frames
- A Tale of Two Orbits
- Other motion problems
- The Sliding Ladder Problem
- Keeping Pace - A Balanced Assessment Task
- Pebble stuck in a wheel -traditional view
- Pebble stuck in a wheel - space-time view
- two lap average
- two lap average - revisited
- Sir Isaac's Cars [nlaw] - a game of kinematics
- Sir Isaac's Slalom
- Modeling & related issues
- A Leaky Bathtub - competing rates & equilibrium
- Archimedes' Surprise
- Aristotle's Wheel
- v(t) = dx(t) / dt - beyond linear functions
- Gear train
- How a DVD player works
- A Car & 20 Questions
- A Car & 20 Questions - Part II
- Two analogous(?) problems
- Normal distribution & cumulative probability
- falling dominoes
- starting wave at a stop light
- Horse on road and field
- Ship rendezvous
- TWO MOTIONS - one path in space
- Model is to Data as Chicken is to Egg
- Model is to Data as Chicken is to Egg
Digital handball
a. How does the landing point depend on the position of the wall ?[br] the initial ↑ velocity ?, the initial → velocity ?[br][br]b. Sketch y(t) and x(t) for the case of a ball bouncing off the wall.[br][br]c. Sketch horizontal and vertical components of velocity as functions of time for the case of a ball bouncing off the wall.[br][br]d. What can you say about the relation between the angle at which the ball hits the wall and the angle at which it leaves the wall?[br][br]e. What happens at the wall? For how long is the ball in contact with the wall? Is your answer realistic? why or why not?[br]Do you think it is OK to use this model of a ball bouncing off a wall? why or why not?
forced damped oscillator
[url=https://www.youtube.com/watch?v=aZNnwQ8HJHU&list=PL860B6886A47E5490&index=34]You can see a video of a forced damped oscillator here[/url]
Two Planets & A Sun - A Digital Triptych
The motions of a Sun and two planets as seen in each of their coordinate systems.[br][br]You can animate the motion by clicking on the lower left hand corner of the screen.[br][br]You can show the trajectories by checking the trajectories checkbox.[br][br]You can show the distances between the bodies by checking the distance checkbox.[br][br]Does this help you understand the retrograde motion of Mars?[br][br]Why does the triangle of distances look the same in all three coordinate systems?[br][br][color=#ff0000][i][b]What questions could/would you ask your students based on this applet?[/b][/i][/color]
The Sliding Ladder Problem
A ladder is leaning against a wall. The base of the ladder starts to slip[br]while the top of the ladder remains in contact with the wall. How does the rung [br]halfway up the ladder move in space as the ladder slips?[br][br]Can you prove your answer?[br][br]How do the other rungs move? What can you say about the path they[br]take as the ladder slips? Can you prove your answer?[br][br][i][b][size=85][Slide the base of the ladder by dragging the BLACK point. Slide the point whose path you [br]want to trace by sliding the RED point.][/size][/b][/i]
A Leaky Bathtub - competing rates & equilibrium
If water comes into a leaky bathtub at a constant rate[br]and leaks out a a rate proportional to the height of the[br]water in the tub, then an equilibrium depth of water in the tub [br]can be reached.[br][br]This applet can be used to explore how the equilibrium depth depends[br]on the rate of flow into and the rate of flow out of the tub.[br][br]Clearly, the leaky bathtub is a metaphor for many equilibrium situations[br]that arise because of competing rates. A height of a helium balloon to which is tied a very long string is another example. Why? Can you think of other examples?[br][br]The applet chooses a random initial volume of water. You can then watch an animation by clicking on the "play" icon in the lower left hand corner of either window.[br][br][color=#ff0000][i][b]What questions could / would you pose to students based on this applet?[/b][/i][/color]
Model is to Data as Chicken is to Egg
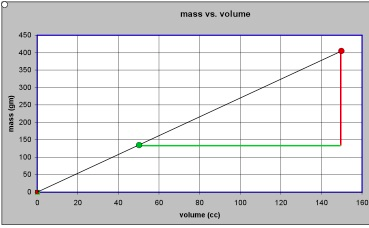
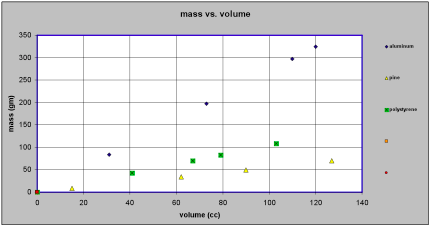
[br][i][b]Model is to data as chicken is to egg - [size=85]an essay for students on formulating models[/size][/b][/i][br][br][b] [/b][br][b]If we have a collection of pieces of aluminum and a collection of pieces pine and a collection of pieces of polystyrene most people would be willing to agree that there is some property of aluminum that is “larger” than that of pine. Suppose, for the moment, we call this property “oomph”[/b].[br][br][b]Is there some way we can pin down what such a property called “oomph” might be? More to the point, is there some way we can say whether the “oomph” of some third material like polystyrene is closer to the “oomph” of aluminum than it is to the “oomph” of pine? And if so, how much closer?[/b][br][br][b]More generally, if we a bunch of different materials, can we find a way to order them according to the “oomph” property – from the “largest” to the “smallest”?[/b][br][br][b]First thoughts would suggest that the relevant property of the aluminum pieces, the pine pieces and the polystyrene pieces that we want to pay attention to is how “big” they are. But by “big” we might mean their physical size (volume – amount of space they take up) or we might mean their weight (or their mass). Clearly each piece of aluminum, pine and polystyrene has [u]both[/u] a volume and a mass.[/b][br][br][b]Assuming we have the proper instruments for measuring volume and mass, we could measure both the volume and the mass for each of the pieces of aluminum, pine and polystyrene. If we do so, we will quickly discover that our mystery property, “oomph”, cannot be mass and it cannot be volume. We can find some pieces of pine with more mass than pieces of aluminum and some pieces of pine with less mass than pieces of aluminum. [/b][br][br][b]If we try to organize our data we might make a table something like this:[/b][br][br][br][table] [tr] [td nowrap][br] [b][i]material[br] 1[/i][/b][br] [/td] [td nowrap][br] [b][i]aluminum[/i][/b][br] [/td] [td nowrap][br] [br][br] [/td] [td nowrap][br] [b][i]material[br] 2[/i][/b][br] [/td] [td nowrap][br] [b][i]pine[/i][/b][br] [/td] [td nowrap][br] [br][br] [/td] [td nowrap][br] [b][i]material[br] 3[/i][/b][br] [/td] [td nowrap][br] [b][i]polystyrene[/i][/b][br] [/td] [/tr] [tr] [td nowrap][br] [b]volume[br] (cc)[/b][br] [/td] [td nowrap][br] [b]mass[br] (gm)[/b][br] [/td] [td nowrap][br] [br][br] [/td] [td nowrap][br] [b]volume[br] (cc)[/b][br] [/td] [td nowrap][br] [b]mass[br] (gm)[/b][br] [/td] [td nowrap][br] [br][br] [/td] [td nowrap][br] [b]volume[br] (cc)[/b][br] [/td] [td nowrap][br] [b]mass[br] (gm)[/b][br] [/td] [/tr] [tr] [td nowrap][br] [b]0[/b][br] [/td] [td nowrap][br] [b]0[/b][br] [/td] [td nowrap][br] [br][br] [/td] [td nowrap][br] [b]0[/b][br] [/td] [td nowrap][br] [b]0[/b][br] [/td] [td nowrap][br] [br][br] [/td] [td nowrap][br] [b]0[/b][br] [/td] [td nowrap][br] [b]0[/b][br] [/td] [/tr] [tr] [td nowrap][br] [b]120[/b][br] [/td] [td nowrap][br] [b]324[/b][br] [/td] [td nowrap][br] [br][br] [/td] [td nowrap][br] [b]15[/b][br] [/td] [td nowrap][br] [b]8.3[/b][br] [/td] [td nowrap][br] [br][br] [/td] [td nowrap][br] [b]41[/b][br] [/td] [td nowrap][br] [b]43.1[/b][br] [/td] [/tr] [tr] [td nowrap][br] [b]73[/b][br] [/td] [td nowrap][br] [b]197[/b][br] [/td] [td nowrap][br] [br][br] [/td] [td nowrap][br] [b]62[/b][br] [/td] [td nowrap][br] [b]34.1[/b][br] [/td] [td nowrap][br] [br][br] [/td] [td nowrap][br] [b]103[/b][br] [/td] [td nowrap][br] [b]108.2[/b][br] [/td] [/tr] [tr] [td nowrap][br] [b]31[/b][br] [/td] [td nowrap][br] [b]83.7[/b][br] [/td] [td nowrap][br] [br][br] [/td] [td nowrap][br] [b]127[/b][br] [/td] [td nowrap][br] [b]69.9[/b][br] [/td] [td nowrap][br] [br][br] [/td] [td nowrap][br] [b]79[/b][br] [/td] [td nowrap][br] [b]83[/b][br] [/td] [/tr] [tr] [td nowrap][br] [b]110[/b][br] [/td] [td nowrap][br] [b]297[/b][br] [/td] [td nowrap][br] [br][br] [/td] [td nowrap][br] [b]90[/b][br] [/td] [td nowrap][br] [b]49.5[/b][br] [/td] [td nowrap][br] [br][br] [/td] [td nowrap][br] [b]67[/b][br] [/td] [td nowrap][br] [b]70.4[/b][br] [/td] [/tr][/table][br][br][b][[i]Note that for each material we have included the data point volume = 0 cc corresponding to mass = 0 gm. This is because if an object has not mass it takes up no space[/i].][/b][br][br][b]Or we might plot our points on graph paper something like this:[/b] [see figure 1][br][br][i][b][u][br][br]Data in tables (symbols) and graphs (images)[/u][/b][/i][br][br][b]It is important to stress that at this point all we have done is to record our [u]data[/u]. We have used two different but equivalent representations, one involving symbols (tables) and the other involving images (graphs). Neither representation is more fundamental than the[br]other. The table records our data in a way that makes the precision of our measured numbers clear. However, it does not make salient whether the masses or the volumes are close to one another or not. The graph, on the other hand, typically does not allow us to read the values of our measurements to the same degree of precision as the table. It does, however, show us whether data points are close to or far apart from one another and it does suggest patterns and regularities that may be present in the table but not apparent.[/b][br][br][b]The only “modeling” we have done is to assume that somehow our mystery property “oomph” can be related in some way to either the mass of and object or its volume or both.[/b][br][br][b]But we have ruled out the possibility of “oomph” depending on mass [u]only[/u] or “oomph” depending on volume [u]only[/u]. [/b][br][br][b]Looking at our data in graphical form suggests a [u]model[/u]. By model in this we mean a recipe or a prescription for predicting the mass of an object if we know its volume or predicting the volume of an object if we know its mass. For example, the highway department may know that a truck can hold 10 cubic meters but needs to know what is the mass of a full load of sand and has no tools for measuring that large a mass of sand, or almond thieves may need to know how large a container they need in order to pack up and get away with 1000 kilograms of almonds. What model do the data suggest?[/b][br][br][b]We can reason from either the table of measurements or the graph of the measured values.[/b][br][br][b]On our table of measured values we see that a 120 cc piece of aluminum has a mass of 324 gm. We might reasonably expect that a 240 cc [2 x 120 cc] piece of aluminum would have a mass of 648 gm [2 x 324 gm] and that a 360 cc [3 x 120 gm] piece of aluminum would have a mass of 972 gm [ 3 x 324 gm]. [/b][br][br][b]On our graph of measured values we see that all the points we measured for aluminum seem to lie on a straight line. All the points we measured for pine also seem to lie on a line, albeit a different line. And all the points measured for polystyrene seem to lie on a third line.[/b][br][br][b]We can capture this pattern of regularity in a mathematical relationship that says that [/b][br][br][center][b][i][u]mass is proportional to volume[/u][/i][/b][b].[/b][/center][b]This is the [u]model[/u] that we will assume.[/b][br][br][br][br][br][i][b][u]The model in symbols[/u][/b][/i][br][br][b]If we try to express this mathematical model in [u]symbols[/u] we can write [/b][br][br][b]for aluminum mass (in gm) = 2.7 x volume (in cc)[/b][br][br][b]and for pine mass (in gm) = 0.55 x volume (in cc)[/b][br][br][b]and for polystyrene mass (in gm) = 1.05 x volume (in cc)[/b][br][br][b]This pattern suggests that the quantities 2.7 gm/cc, 0.55 gm/cc and 1.05 gm/cc somehow characterize the materials aluminum, pine and polystyrene respectively. Could these quantities be a measure of the mystery property “oomph”?[/b][br][br][b]Suppose we use a symbol like the letter [i]d[/i] to stand for the quantity that characterizes the material. Then we can write our mathematical model in symbols more generally as [/b][br][center][br][b][i]mass = d x volume [/i][/b][b]or[i] m = d x v[/i][/b][/center][b]If mass is measured in grams and volume is measured in cc then [i]d[/i] must be in gm/cc. [/b][br][br][br][br][i][b][u][br]The model in images[/u][/b][/i][br][br][b]We can also try to express our model in images as suggested by the graph representation of our data. Our plotted data suggest that object made of a given material will have masses and volumes that are related in such a way that they will lie on a straight line [that goes through the point mass = 0, volume = 0 ] when plotted in a Mass vs. Volume graph.[br]Clearly what characterizes a given material is the [i]slope[/i] of that line. The line for aluminum climbs faster than the line for pine – and we say that that line has a greater slope.[/b][br][br][b]People who build roofs on houses, install plumbing pipes or handicap access ramp all measure slope in the same way. They ask “how much does the {roof, pipe, ramp} [i]rise[/i][br]for every unit of horizontal [i]run[/i] of the {roof, pipe, ramp}? The amount of [i]rise[/i] divided by the amount of [i]run[/i] is a measure of the slope.[/b][br][br][b]Suppose we have two aluminum objects [[i]the green dot and the red dot in the graph[/i]], one having a volume that is 100 cc [i]greater[/i] than the other. Our model tells us that because they are made of the same material their data points will lie on the same straight line. To get from the green dot to the red dot we have to [i]run[/i] horizontally 100 cc and then [i]rise[/i] vertically 270 gm. Another way of saying this is that we have to [i]rise [/i]vertically 2.7 gm for every horizontal [i]run[/i] of 1 cc. The slope of our aluminum line is 2.7 gm/cc[/b] [see figure 2][br][br][b]Coming from our model expressed in graphical form, the quantity that expresses the characteristic property of the material is the slope of the line that corresponds to that material.[/b][br][br][b]How does our model expressed in graphical form correspond to our model expressed in symbolic form?[/b][br][br][b]In the symbolic form of our model, which says “[i]mass is proportional to volume[/i]” , the[br]quantity that characterizes the material we have in mind is the quantity that multiplies the volume to yield the mass. In the graphical form of our model, the quantity that characterizes the material we have in mind is the quantity that measures the [i]slope[/i] of the line for that material. [/b][br][br][b]These are two representations of the same quantity – the density of the material.[/b][br][br][br][b][u][br][br]The Bottom Line[/u][/b][br][br][b]We start with some initial notions about what quantities might be important enough in a given situation to warrant our collecting data. [/b][br][br][b]We can organize our collected data in different ways. Moreover, the collected data may lead us to propose a model which allows us to predict the result of as yet unmade measurements. [/b][br][br][b]Needless to say, we must then collect more data to see if the predictions of our model are upheld. This activity may lead us to refine our model.[/b][br][br][b]So here is something to think about – do you really believe that no matter how small a piece of aluminum you take the mass of the piece of aluminum in grams is 2.7 times the volume of that piece of aluminum in cc? It really seems to work over a very wide range of values – but suppose we start to get to sizes that are comparable to the sizes of atoms? Or smaller?[/b][br][br][br][b] [/b][br][br][br][br][br][br][br]
figure 1
figure 2