
Color Palette Tool & Examples
A tool to select a color palette without the need to change color schemes from RGB to HSV. More details here: [url]https://mathed.miamioh.edu/index.php/ggbj/article/view/265/174[/url]
Table of Contents
- Basic setup & Color palette tool
- Tool for Exploring Color Palettes
- Simple example: Colored circle
- Advanced examples
- Advanced example 1: Colored circles
- Advanced example 2: Infinite curve
- Advanced example 3: Colored vector field 3D
- Extra examples
- Example of using color palette
- International Day of Mathematics 2025
- Shaders examples
- Desmos examples
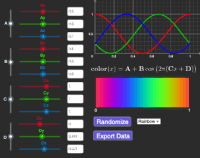
Tool for Exploring Color Palettes
A tool to create color palettes based on Iñigo Quilez's method: [url=https://iquilezles.org/articles/palettes/]Procedural Color Palette[br][br][/url]Change the values of [b]A[/b], [b]B[/b], [b]C[/b], and [b]D[/b] manually, or by dragging the sliders.[br]To get the values just click the button [b]Export Data[br][/b][br][b]Sample Output:[/b][br][code][/code]A = (0.5, 0.5, 0.5); B = (0.5, 0.5, 0.5); C = (1, 1, 1); D = (0, 0.333, 0.637);
Also check the full details here: [url=https://mathed.miamioh.edu/index.php/ggbj/article/view/265/174]Using a procedural color palette in GeoGebra[/url]
This tool is particularly useful in GeoGebra, so you don't have to change the color scheme of objects manually, from RGB to HSV.[br][br]Here is an example: https://www.geogebra.org/m/ysczgrya
[b]Note:[/b] There is another similar tool developed by [url=mailto:k@thi.ng]Karsten Schmidt[/url] available here: [url=http://dev.thi.ng/gradients/]Cosine Gradient Generator[/url]
If you like this applet, you can support me in Patreon:[br][br]https://www.patreon.com/jcponce[br][br]∞ Thanks! :)
Advanced example 1: Colored circles
Script Setup
[code]A = (0.5, 0.5, 0.5)[br]B = (0.5, 0.5, 0.5)[br]C = (1, 1, 1)[br]D = (0, 1/3, 2/3)[br][br]functionRed(x) = x(A) + x(B) * cos(2pi(x(C) * x + x(D)))[br]functionGreen(x) = y(A) + y(B) * cos(2pi(y(C) * x + y(D)))[br]functionBlue(x) = z(A) + z(B) * cos(2pi(z(C) * x + z(D)))[br][br]Execute(Zip("C"+i+" = Circle((4*random(),4*random()), RandomUniform(0.2, 1))", i, 1..10))[br][br]Execute(Zip("SetDynamicColor(C"+i+",Min(1, Max(0, functionRed("+i+"/10))), Min(1, Max(0, functionGreen("+i+"/10))), Min(1, Max(0, functionBlue("+i+"/10))),1)", i, 1..10))[/code]
Example of using color palette
This is an example to implement HSV scheme to objects without changing the color settings of the objects manually.[br][br]I used this applet: [url=https://www.geogebra.org/m/rnzrfxph]Color palettes[/url]
Script Setup
[code]n = 20[br]Ln = 1...n[br][br]speed = 1[br]t = Slider(0, 2 pi, 0.01, speed, 200)[br]f(x) = sin( (20x + t))[br][br]Execute(Zip("P"+k+" = ("+k+", f("+k+"))", k, Ln))[br]Execute(Zip("ShowLabel(P"+k+", false)", k, Ln))[br][br]Execute(Zip("C"+k+" = Circle(P"+k+", 1)", k, Ln))[br]Execute(Zip("ShowLabel(C"+k+", false)", k, Ln))[br][br]A = (0.5, 0.5, 0.5)[br]B = (0.5, 0.5, 0.5)[br]C = (1, 1, 0.85)[br]D = (0, 0.33, 0.67)[br][br]Red(x) = x(A) + x(B) * cos(2pi(x(C)*x+x(D)))[br]Green(x) = y(A) + y(B) * cos(2pi(y(C)*x+y(D)))[br]Blue(x) = z(A) + z(B) * cos(2pi(z(C)*x+z(D)))[br]SetVisibleInView(Red, 1, false)[br]SetVisibleInView(Green, 1, false)[br]SetVisibleInView(Blue, 1, false)[br][br]Execute(Zip("SetDynamicColor(C"+k+", Red("+k+"/n), Green("+k+"/n), Blue("+k+"/n), 1)", k, Ln))[br][br]ShowGrid(false)[br]ShowAxes(false)[br][/code]