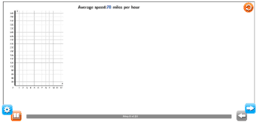
On the way to the Grand Canyon, Eric drove his car at an average speed of 70 miles per hour. Explore the relationship between the total distance Eric traveled and the time he spent driving. Identify the independent and dependent quantities, and choose variables to represent them. Then, create an equation, a table, and a graph for this situation.


