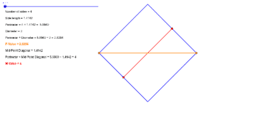
Student should record the P-vaue and M-value for different values of n and plot the results on a graph.
The two values will converge on pi, one from above and one from below.
Students can be asked about what value on n is required to have pi accurate to 1, 2, 3, etc significant figures.
The task could be use with older students who can generalise the values using trigonometry.


