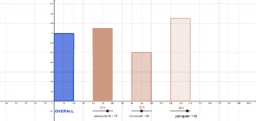
Grade Bar Graph (50-30-20)
The following bar graph helps students visualize their grade according to the following breakdown:
Assessments: 50%
Homework: 30%
Participation: 20%
- Målgruppe (alder)
- 14 – 18
- Sprog
- English (United States)
Fejl
Timeout. Prøver at gemme igen …
Serveren svarer ikke. Vent venligst et øjeblik og prøv herefter at gemme igen.