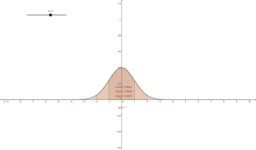
Normal curve with dynamic standard deviation
I wanted to observe which properties of the normal curve change when the standard deviation is changed. I have added total area under the curve and areas under 1,2,3 deviations.
- Grupo destino (edad)
- 15 – 19+
- Idioma
- English
Se guardaron todos los cambios
Error
Finalizó el tiempo disponible. Intenta grabar nuevamente.
El servidor no responde. Por favor, intenta guardar nuevamente en unos minutos.