Effects of Scale Interval Changes
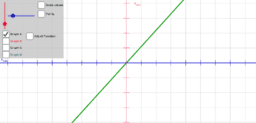
Show the effects of scale interval changes on two different graphs. Sliders change the axes scale intervals and two points can be used to explore scale interval changes on slope. The points to determine slope stay on the function when the scale is changed.
- Hedef Grup (Yaş)
- 11 – 14
- Dil
- English (United States)
Bütün değişiklikler kaydedildi
Hata
Bir zaman aşımı oluştu. Tekrar kaydetmeyi deniyor...
Üzgünüz, fakat sunucu yanıt vermiyor. Lütfen bir kaç dakika bekledikten sonra kaydetmeyi yeniden deneyin.