This practice is intended for students to review and consolidate the learning of the concept of linear functions of two variables.
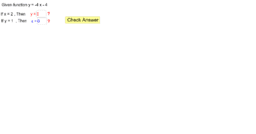
Given a linear equation 3x + 2y = 1,
we can represent it as a straight line graph, using pairs of x and y values which satisfy the linear equation, to plot the straight line.
and the concept of y as the variable that contain the output values calculated based on the "rule" or y = x + 4 is being reinforced in the practice here.
The student also gets to see the graph of each linear function generated and the points which represent the point for the x and y values that were generated for self assessment.