Creating Arctangent Graph
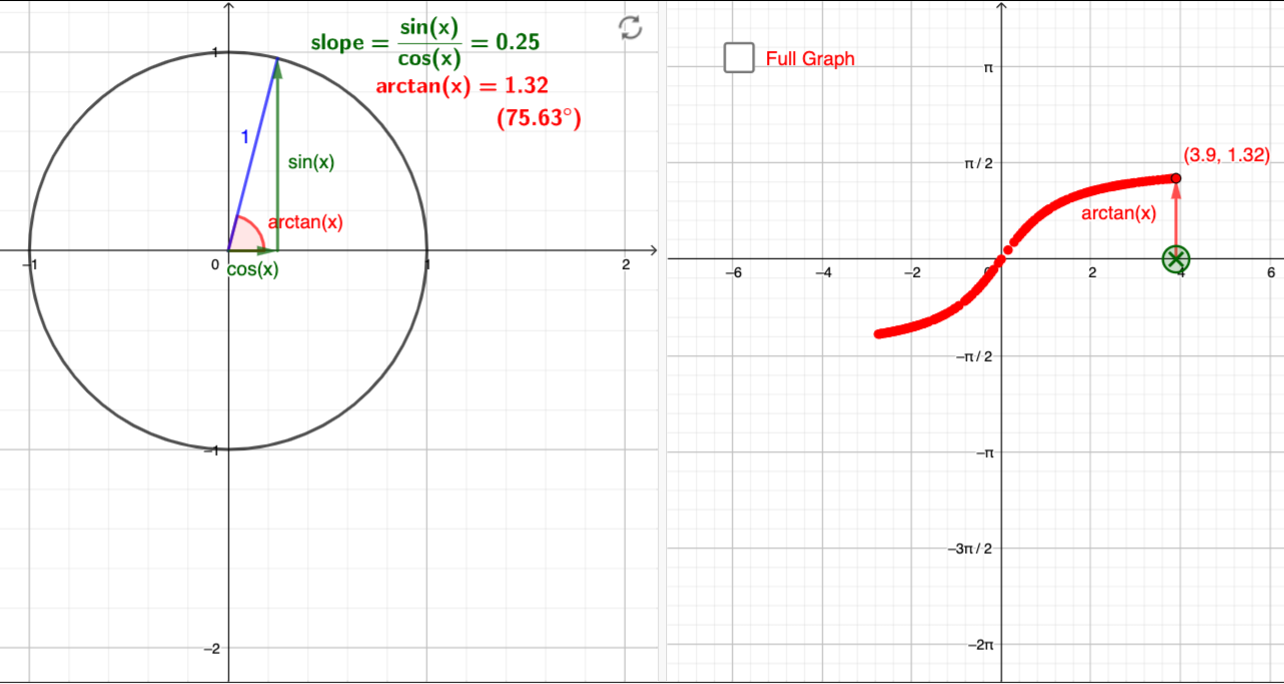
Move the input slope (marked by the green X on the right graph) to observe both the value of the function and the creation of its graph, which is traced out by the points as you change the angle. Simultaneously, observe the unit circle definition on the left set of axes.
- Doelgroep (leeftijd)
- 12 – 19+
- Taal
- English
Alle wijzigingen werden opgeslagen
Error
Opslaan duurde te lang. Er wordt opnieuw geprobeerd om op te slaan …
De server reageert niet. Wacht a.u.b. enkele minuten en probeer daarna opnieuw om op te slaan.