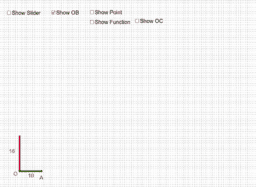
This applet allows students to see a proportional relationship between two co-varying quantities. If the value of [i]x[/i] (represented by the length of the green horizonatal line segment [i]OA[/i]) increases, the value of [i]y[/i] (represented by the length of the red vertical line segment [i]OB[/i]) increases proportionally. The constant of proportionality is initially set at 1.6. The slider is for changing the constant of proportionality.
By turning on "Show Point", students can learn that the point [i]C[/i] at position ([i]x[/i],[i] y[/i]) means it is [i]x[/i] units away from the vertical axis and [i]y[/i] units away from the horizontal axis. A point ([i]x[/i], [i]y[/i]) shows one specific instance.
By turning on "Show Function", the line representing the relationship between the two quantities [i]x[/i] and [i]y[/i] becomes visible. The big idea is that a function can also be represented by a set of instances such as (10, 16). Each instance can be represented using Cartesian coordinates. A graph is a set of points with [i]x[/i] and [i]y[/i] values that satisfy the equation for the function.