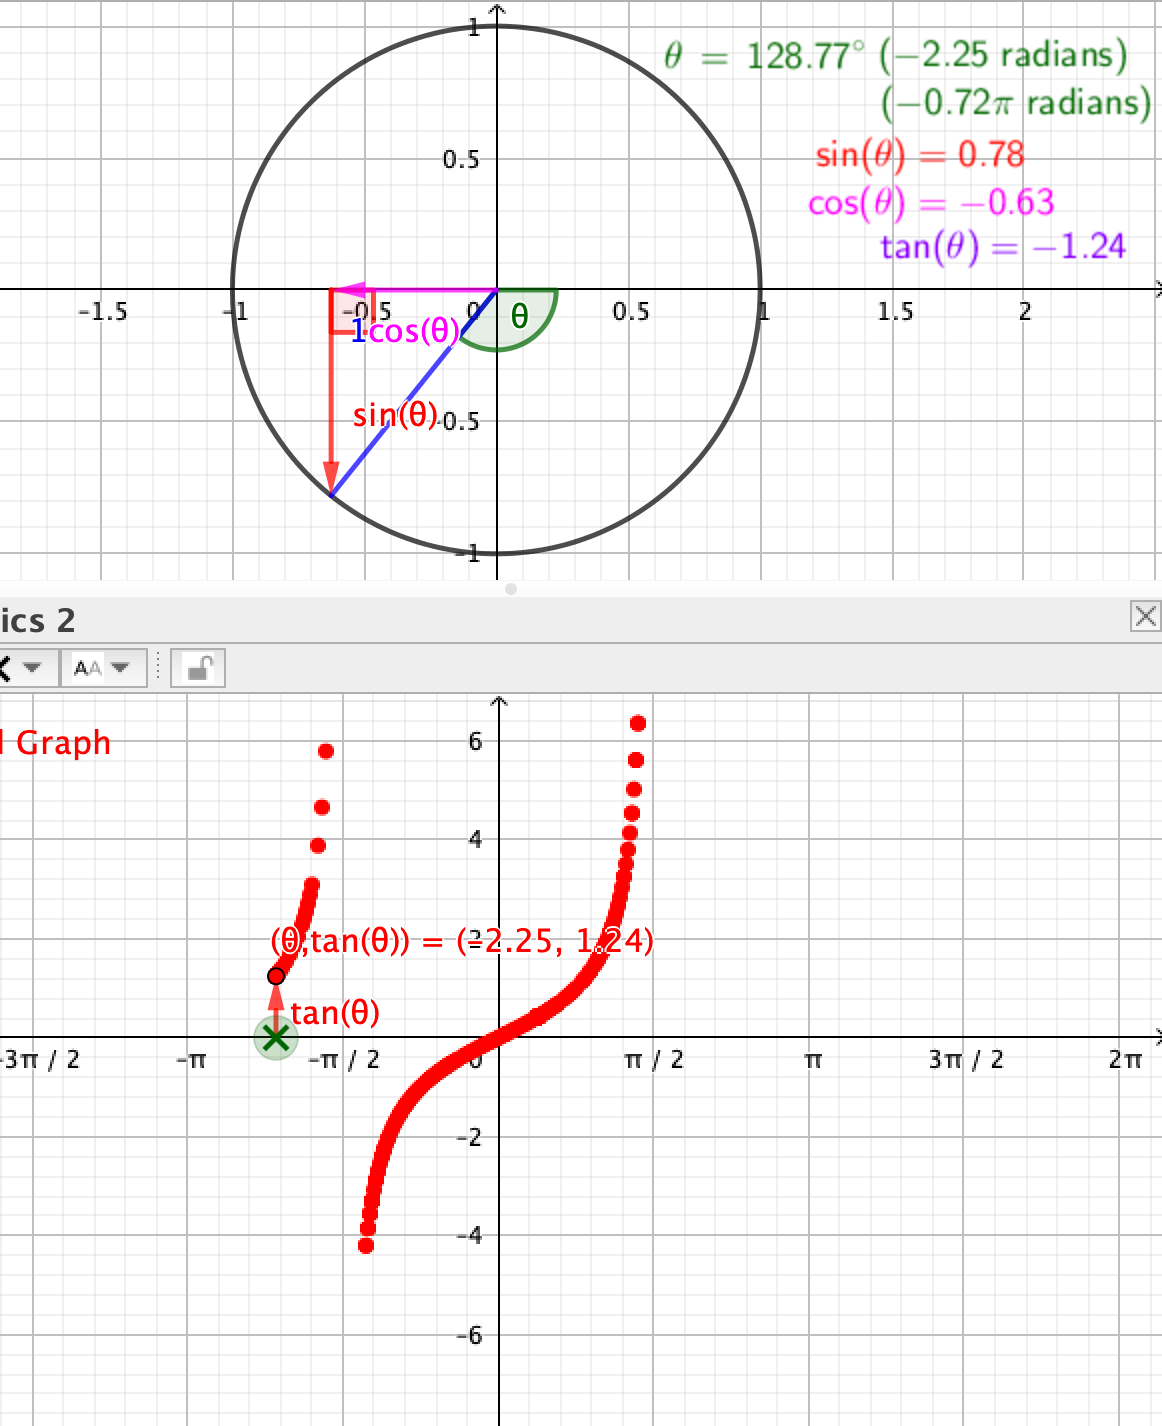
Create the graph of the tangent by moving the values of the angles on the x-axis and seeing both the values of the sine, cosine, and tangent of the angles on the unit circle and the resulting points on the tangent graph.
- Tranche d'âges
- 12 – 19+
- Langue
- English
Toutes les modifications ont été sauvegardées
Erreur
Un problème de délai est survenu. Essayer à nouveau ...
Désolé, mais le serveur ne répond pas. Attendre quelques minutes, puis essayer de sauvegarder à nouveau.