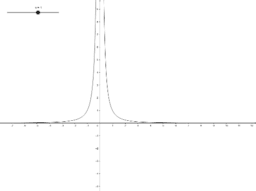
Describing Variation Graph Station 4: The Graph of y = k/x^2
This is worksheet number 4 in a lab allowing students to explore the Inverse Quadratic Variation using a slider for k.
- Gruppo di riferimento (età)
- 14 – 18
- Lingua
- English (United States)
Tutte le modifiche sono state salvate
Errore
Si è verificato un timeout. Nuovo tentativo di salvataggio in corso …
Spiacenti, il server non risponde. Attendi qualche minuto e prova nuovamente a salvare.