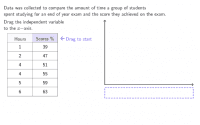
Reveal how to create a scatter plot by identifying dependent and independent variables, and then plotting data points from a table.
- Grupo destino (edad)
- 3 – 19+
- Idioma
- English
Se guardaron todos los cambios
Error
Finalizó el tiempo disponible. Intenta grabar nuevamente.
El servidor no responde. Por favor, intenta guardar nuevamente en unos minutos.