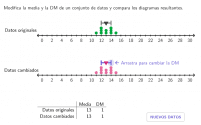
Comparación de diagramas de puntos
Observa cómo las variaciones en un conjunto de datos afectan su representación en un diagrama de puntos.
- Resource Type
-
Activity
- Tags
-
- Target Group (Age)
- 3 – 19+
- Language
- Spanish (Spain) / Español (España)
Error
A timeout occurred. Trying to re-save …
Sorry, but the server is not responding. Please wait a few minutes and then try to save again.