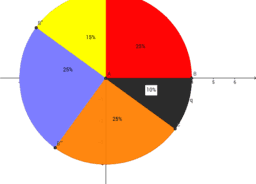
Find the number of data from the circle graph.
Use the percents on the graph to figure how many in each category.
- Tranche d'âges
- 11 – 14
- Langue
- English (United States)
Toutes les modifications ont été sauvegardées
Erreur
Un problème de délai est survenu. Essayer à nouveau ...
Désolé, mais le serveur ne répond pas. Attendre quelques minutes, puis essayer de sauvegarder à nouveau.