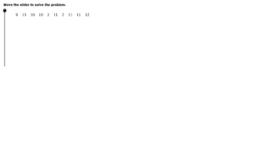
CCGPS AA 1.1.1 Example 1

The following data set shows the numbers of minutes it took [math]10[/math] chemistry students to complete a quiz: [math]\, \, \, \, \,9\, \, \,13\, \, \, 10\, \, \, 10\, \, \, 2\, \, \, 11\, \, \, 2\, \, \, 11\, \, \, 11\, \, \, 12[/math] Describe the data set, using appropriate measures of center and spread. Identify any outliers or other extreme values and describe their effects.


Walch Education

 
Type de ressources
Activité
Balises
box-plot  data  data-set  dot-plot  extreme-values  maximum  measures-of-center  measures-of-spread  median  median-value  minimum outliers practice Voir davantage …
Tranche d'âges
15 – 18
Langue
English (United States)
 
 
Version GeoGebra
4.4
Vues
2213
Contacter l'auteur de la ressource.
 
 
© 2025 International GeoGebra Institute