January 12th In-Service Book

Tabla de Contenidos
- Algebra I
- Slope: Intuitive Intro and Exploration
- Graph the Line
- Parallel Lines Investigation
- Perpendicular Lines Investigation (VB)
- The Z Pattern
- Systems of Equations on a Graph
- Solving Proportions
- Geometry
- 5.5 Midsegment Theorem Investigation
- Pythagorean Theorem Proof
- 3: Volume and Surface Area of Cylinders
- Find Surface Area and Volume of Cylinder
- Congruent Triangles
- SSS: Dynamic Proof!
- SAS: Dynamic Proof!
- ASA Theorem?
- Triangle Angle Sum Theorem
- Arc length: Quick Investigation
- Circle Area (By Peeling!)
- Medians and Centroid Dance
- Congruent Triangles 3 (AAS)
- Area of a Circle - Wedge/Sector Demonstration
- HL: Hypotenuse-Leg Action!
- Triangle Angle Theorems
- Algebra II
- Exponential Functions: Graphs
- Vector Addition of Two Vectors
- Factoring Quadratics
- Factoring a Difference of Two Squares and Perfect Squares
- Completing the Square (1)
- Completing the Square (2)
- Completing the Square (3)
- Completing the Square
- Interval Notation Illustrator: Single Sets & Conjunctions
- Messing With Lisa
- Pre-Calculus
- Ellipse eccentricity
- Elipse
- Conic sections
- Pythagorean Trigonometric Identity (1)
- Sine & Cosine of a Sum: Discovery
- Calculus Honors and AB
- Reimann Sum
- Disc method
- Disc Action!!!
- Secant Lines and the Derivative
- Related Rates (3)
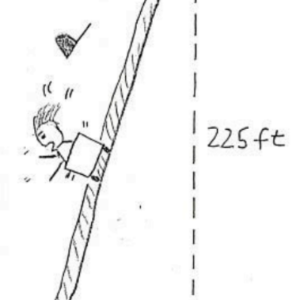
- Falling Ladder !!!
- Introduction to limits
- Position, Velocity, and Acceleration vs. Time Graphs
- Derivative Function: Without Words
- Cont in uity
- Calculus BC
- U-Substitution (Definite Integrals)
- Integral Test for Series
- Addition of vectors
- Cylindrical Shell Action!!! (1)
- Statistics
- Rolling two dice
- Flip a Fair Coin
- Flip My Coin
- Normal Distribution Worksheet
- Skewed Distribution, Mean and Median
- Skewed or Normal Distributions
- Lotto Tickets Simulation
- Compare Box and Whisker Plots
- Chi Squared Distribution Calculator
- Physics
- Displacement, Velocity & Acceleration
- Dragging a Sled with a Rope
- Inclined Plane with Two Masses and a Pulley
- Problem of movement
- Harmonic Motion
- vector grapher
Slope: Intuitive Intro and Exploration
[size=200][color=#1e84cc][url=https://drive.google.com/open?id=1ZbntWgv0ZB6aYtlXpdzDpfuKHrMYWJqe]Warm Up Questions[/url][br][br][url=https://docs.google.com/document/d/1W5fggl-QmnwOoT1Yjs2MfZnwVzIF49pflGX33xe0PN0/copy?usp=sharing]Student Exploration To Accompany Resource[/url][/color][/size]
Slide the slider all the way to the right. Then move the LARGE POINTS around to change the slope of the line. Use this interactive figure to help you complete the investigation in the 2nd URL above.
After completing the investigation above, take some time test your slope knowledge skills. If you're having trouble with any question, refer back to the resource above.
[size=200][color=#1e84cc][url=https://www.geogebra.org/m/xefdkxqm]SLOPE: Quick Intuitive Quiz Questions[/url][br][br][url=https://www.geogebra.org/m/rtbwk2wv]SLOPE: Graphing Slope Types[/url][br][/color][/size][size=200][color=#1e84cc][br][url=https://www.geogebra.org/m/gV9GRCRN]SLOPE: Quiz (1)[/url][br][br][url=https://www.geogebra.org/m/Pkb2Z9z5]SLOPE: Quiz (2)[/url][/color][/size]
5.5 Midsegment Theorem Investigation
Student-Constructed GeoGebra Sketch: Easy to Create and Formulate & Test Conjectures!
NOW YOU TAKE THE ROLE of the STUDENT! Use the given GeoGebra tools below to recreate as much of the sketch shown above! (Color matching not necessary.)
QUESTION:
Any segment connecting midpoints of 2 sides of a triangle is called a MIDSEGMENT of that triangle. Move the triangle's vertices around. What seems to be true about the midsegment of ANY TRIANGLE?
GeoGebra for MEANINGFUL REMEDIATION or CONCEPTUAL DISCOVERY for Students Needing More Support. Move the triangle's WHITE VERTICES anywhere you'd like!
[b][color=#0000ff][url=https://docs.google.com/document/d/1HsFCBz3suKP-AhU50diM9G9zdtdswAsaR-m4jCJ8omI/edit?usp=sharing]Triangle Midsegment Action: Link to a Discovery Learning Lesson using the applet above[/url]. [/color][/b]
Student-Constructed GeoGebra Sketch: Easy to Create and Formulate & Test Conjectures!
Exponential Functions: Graphs
The following applet displays the graph of the exponential function [math]f\left(x\right)=c\cdot a^{kx}+d[/math]. [br]Interact with the applet below for a few minutes, then answer the questions that follow.
[b][color=#000000]Questions:[/color][/b][br][br][color=#000000]1) How does the parameter [/color][color=#cc0000][b]a[/b][/color] [color=#000000]affect the graph of the exponential function? Explain. [br] What happens if [/color][color=#cc0000][b]a > 1[/b][/color][color=#000000] and [/color][color=#1e84cc][b]k > 0[/b][/color][color=#000000]? What happens if [/color][color=#cc0000][b]a < 1[/b][/color][color=#000000] and [/color][color=#1e84cc][b]k > 0[/b][/color][color=#000000]? [br][br][/color][color=#000000]2) How does the parameter [/color][b][color=#1e84cc]k[/color][/b][color=#000000] affect the graph? Explain. [br] If you need a hint, refer back to [url=https://www.geogebra.org/m/HJvZSUna]this worksheet[/url]. [br][br][/color][color=#000000]3) What does the parameter [/color][color=#980000][b]d[/b][/color][color=#000000] do the graph? Explain. [br][br][/color][color=#000000]4) Suppose [/color][color=#cc0000][b]a < 1[/b][/color][color=#000000]. [br] Given this constraint, is it possible to get the graph of this exponential function to look the way it does[br] when [/color][color=#cc0000][b]a > 1[/b][/color][color=#000000] and [/color][color=#1e84cc][b]k > 0[/b][/color][color=#000000]? Explain. [/color]
Ellipse eccentricity
Shows effect on ellipse when eccentricity changes.
Ellipse eccentricity
Reimann Sum
Adjust n to increase or decrease number of interval
U-Substitution (Definite Integrals)
Rolling two dice
Rolling two dice
Problem: when rolling two fair dice, a sum of 9 occurs more often than a sum of 10. [br]But 9=3+6=4+5 and 10=4+6=5+5, therefore there are 2 ways to get a sum of 9 and 10.