Example 1
|
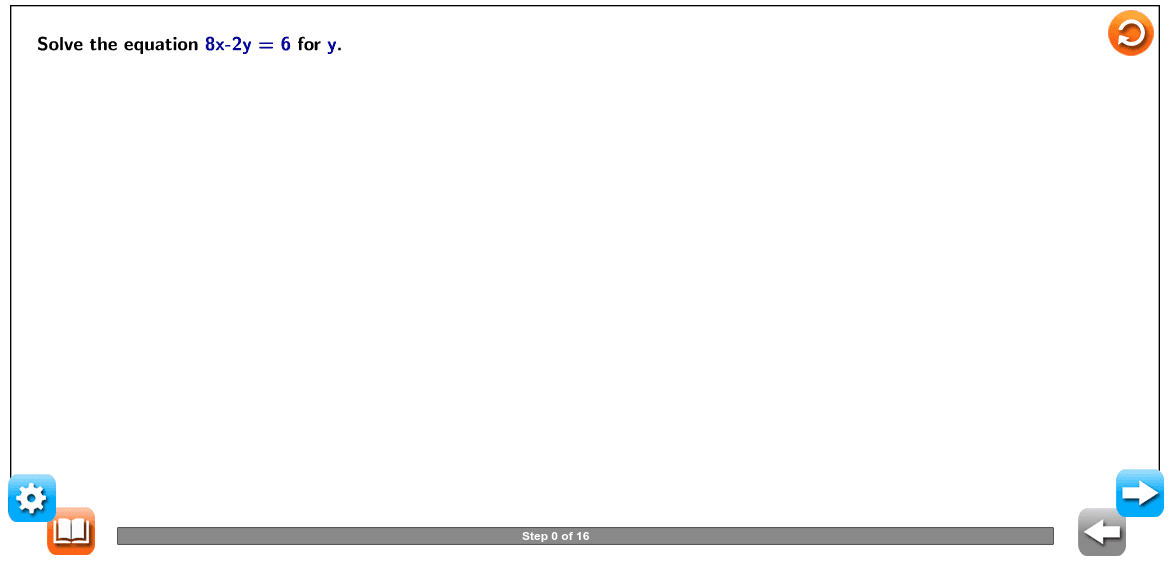
Solve the equation [math]8x – 2y = 6[/math] for [math]y[/math]. |
|
|
|
[list=1] [*]Move the term with [math]x[/math] to the other side of the equation by adding its opposite to both sides of the equation. [*]Divide every term on both sides of the equation by the coefficient of [math]y[/math]. [/list] This applet is provided by Walch Education as supplemental material for their mathematics programs. Visit [url="http://www.walch.com"]www.walch.com[/url] for more information on their resources. |
Example 3
|
The shaded half plane in the graph shown represents the solution set for the inequality [math]y < 2x – 1[/math]. Use both substitution and the graph of the inequality to determine which values from the set [math]{(–4, 3), (–1, –8), (3, 7), (5, –1)}[/math] make the inequality true. |
|
|
|
[list=1] [*]Use substitution to determine if [math](–4, 3)[/math] makes the inequality true. [*]Use the graph of the inequality [math]y < 2x – 1[/math] to determine if [math](–4, 3)[/math] makes the inequality true. [*]Use substitution to determine if [math](–1, –8)[/math] makes the inequality true. [*]Use the graph of the inequality [math]y < 2x – 1[/math] to determine if [math](–1, –8)[/math] makes the inequality true. [*]Use substitution to determine if [math](3, 7)[/math] makes the inequality true. [*]Use the graph of the inequality [math]y < 2x – 1[/math] to determine if [math](3, 7)[/math] makes the inequality true. [*]Use substitution to determine if [math](5, –1)[/math] makes the inequality true. [*]Use the graph of the inequality [math]y < 2x – 1[/math] to determine if [math](5, –1)[/math] makes the inequality true. [*]Summarize your results. [/list] This applet is provided by Walch Education as supplemental material for their mathematics programs. Visit [url="http://www.walch.com"]www.walch.com[/url] for more information on their resources. |
Example 2
|
The amount of money Garrett will raise for charity by participating in a walkathon can be modeled by the linear function [math]d = 50m + 120[/math], for which [math]m[/math] is the number of miles he walks and [math]d[/math] is the number of dollars he raises. The value [math]120[/math] represents how much of his own money Garrett donated before the walkathon started. Find the domain and the range of this function. |
|
|
|
[list=1] [*]Identify the domain of the function. [*]Identify the range of the function. [/list] This applet is provided by Walch Education as supplemental material for their mathematics programs. Visit [url="http://www.walch.com"]www.walch.com[/url] for more information on their resources. |
Example 3
|
Logan is looking for a part-time job to help pay for his car. He wants to work more than 10 hours a week, but no more than 18 hours a week. Use interval notation to express the number of hours, [math]h[/math], Logan wants to work. |
|
|
|
[list=1] [*]Write an inequality to represent the number of hours Logan wants to work. [*]Write the inequality using interval notation. [/list] This applet is provided by Walch Education as supplemental material for their mathematics programs. Visit [url="http://www.walch.com"]www.walch.com[/url] for more information on their resources. |
Example 3
|
A customer at a copy shop has $6.00 remaining on a prepaid card. Black-and-white copies cost $0.12 each, and color copies cost $0.20 each. The equation [math]12x + 20y = 600[/math] models this situation, where [math]x[/math] is the number of black-and-white copies and [math]y[/math] is the number of color copies the customer can make by using the card. What is the maximum number of color copies the customer can make? |
|
|
|
[list=1] [*]Convert the equation into slope-intercept form. [*]Find the values of [math]m[/math] and [math]b[/math]. [*]Determine the [math]y[/math]-intercept of the line represented by the equation. [*]Determine the maximum number of color copies the customer can make. [/list] This applet is provided by Walch Education as supplemental material for their mathematics programs. Visit [url="http://www.walch.com"]www.walch.com[/url] for more information on their resources. |
Example 1
|
On a road trip, Jameson drove his car at an average speed of 60 miles per hour. Explore the relationship between the total distance that Jameson traveled and the time that he spent driving. Identify the independent and dependent quantities, and choose variables to represent them. Then, create an equation, a table, and a graph for the situation. |
|
|
|
[list=1] [*]Identify the independent and dependent quantities. [*]Choose variables to represent the independent and dependent quantities. [*]Write an equation to represent the relationship between the independent and dependent variables. [*]Create a table of values to represent the relationship between the independent and dependent variables. [*]Use the table to create a graph that represents the relationship between the independent and dependent variables. [/list] This applet is provided by Walch Education as supplemental material for their mathematics programs. Visit [url="http://www.walch.com"]www.walch.com[/url] for more information on their resources. |
Example 1
|
Simplify the expression 9 × (–5). |
|
|
|
[list=1] [*]Find the absolute value of each number in the expression. [*]Multiply the absolute values. [*]Determine the sign of the product. [/list] This applet is provided by Walch Education as supplemental material for their mathematics programs. Visit [url="http://www.walch.com"]www.walch.com[/url] for more information on their resources. |
