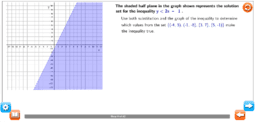
The shaded half plane in the graph shown represents the solution set for the inequality [math]y < 2x – 1[/math].
Use both substitution and the graph of the inequality to determine which values from the set [math]{(–4, 3), (–1, –8), (3, 7), (5, –1)}[/math] make the inequality true.