GED Social Studies

[color=#c51414][b]G[/b]eneral [b]E[/b]ducational [b]D[/b]evelopment[/color] (GED) tests are a group of four subject tests which, when passed, certify that the test taker has American or Canadian high school-level academic skills. Here are some topics which can assist students in learning the mathematics covered on the GED/HiSET/TASC/GCSE [color=#c51414][b]G[/b]eneral [b]C[/b]ertificate of [b]S[/b]econdary [b]E[/b]ducation[/color]. Book 1 is a compilation of basic skills needed for success, but not tested. [b]Mostly PreGED/ABE Skills[/b] Book 2 has many activities which are tested. [b]Many GED Level Skills[/b] [b]GED/ABE Mathematics Book1[/b] [url]https://www.geogebra.org/m/j4UyPdKW[/url] [b]A B Cron[/b] [b]GED Mathematics Book 2[/b] [url]https://www.geogebra.org/m/mEs37yMj[/url] [b]A B Cron[/b] [b]GED Science[/b] [url]https://www.geogebra.org/m/kH5xMUpw[/url] [b]A B Cron[/b] [b]GED Social Studies[/b] [url]https://www.geogebra.org/m/bsbnpmyp#material/r7gesnmq[/url] [b]A B Cron[/b] [b]GED Slope[/b] [url]https://www.geogebra.org/m/cvAySD7E[/url] Thanks, Tim B. [b]Geometry Introduction[/b] [url]https://www.geogebra.org/m/dsGHMH8u[/url] [b]A B Cron[/b] [b]Nets of Solids[/b] (Surface Area and Volume Animations) [url]https://www.geogebra.org/m/gU22RUUA#material/J3Bmsxp3[/url] [b]GED MATH 2015-2021 Linear Algebra & Geometry [/b] [url]https://www.geogebra.org/m/ATn8TUCm[/url] [b]Basic Arithmetic Facts for GED[/b] [url]https://www.geogebra.org/m/x4qx9bz5[/url] [b]Prime Numbers Game[/b] [url]https://mathsbot.com/puzzles/findThePrimes[/url] [b]Multiplication with Area Models[/b] [url]https://www.geogebra.org/m/vfffrx2z[/url] [b]GeoGebra Math Activities[/b] [url]https://www.geogebra.org/math[/url] [b]GeoGebra Math Practice[/b] [url]https://www.geogebra.org/mathpractice/en[/url] [b]Graspable Math[/b] [url]https://activities.graspablemath.com/[/url] [b]Daniel Mentrard[/b] [url]https://www.geogebra.org/u/daniel+mentrard[/url] [b]GeoGebra Resources for Wayne Township[/b] [url]https://geogebra.wayne.k12.in.us/home[/url] All of the first four web links have a section on with notes on what is on the test, as well as, interactive practice activities to assist you in passing. The first item on the main menu has an app leading to files describing the most common errors on that test. Within that menu are lesson on tables and graphs which is an area many do not do well on. Throughout the remain menus there apps that cover multiple skills which can assist you in learning what you need. Use this with your study guide from your GED Ready Exam or GED Exam.
Table of Contents
- GED Social Studies PDFs
- GED Social Studies PDFs
- Civics and Goverment
- A mathematical approach to GDP
- US History
- Finding Actual Distances Using an Interactive Map
- Economics
- Revenue, Cost, Profit: Intro
- Economic Ordering Quantity
- USA population prepared for analysis
- Geography and the World
- Earth (basic model)
- US map
- Bearings Map of Europe
- Eqal Proportion
- Math Skills Needed
- Mean, Median, Mode, and Range
- Interpreting Bar Graphs
- Tables, Graphs, and Linear Equations
- Bar Charts and Pie Charts
- Bar Graphs
- Creating Double Bar Graphs
- Linear vs. Nonlinear Relationships in Graphs
GED Social Studies PDFs
What is Social Studies? | Social Studies Guide for Parents and Teachers
[b]List of common errors made by students on Social Studies Exam.[/b][br][list][*]Charts, graphs, and Data Tables used on GED Exams.[br][/*][*]Maps of world[/*][*]Interpretations of Cartoons[/*][*]Political Cartoons use in USA and their characterizations[/*][*]Governments of the World[/*][*]18th Century[/*][*]19th Century[/*][*]20th Century[/*][*]21st Century[/*][*]USA Government Branches[/*][*]Constitution, Bill of Rights[/*][*]House & Senate, Legislative Processes[/*][*]How Bill Becomes a Law[/*][*]Executive Branch[/*][*]Legislative Branch[/*][*]Judicial Branch[/*][*]Checks and Balances between the 3 branches[/*][*]Wars from 1770-Present[br][/*][/list]
SocialStudiesBootCamp
Government Types
Monarchy[br]Democracy[br]Republic[br]Socialism[br]Communism[br]Fascism[br]Nazism[br]Traditional Capitalism[br]
Government Types

US Government Diagrams
How different governments work, especially the USA.
US Government Diagrams

What is on the Social Studies Test
About 50 percent of questions on civics and government.[br][justify] o US Civics--the study of the rights and duties of citizenship[br] o US Government--the system in which a nation, state, or community is governed--democratic republic[br] o Other governmental systems (two cows)[/justify]About 20 percent of questions are on U.S. history.[br] o Colonial–1600-1770[br] o American Revolution--1770-1792[br] o Major US wars--1776-present[br][br]15 percent of the questions address topics in economics, and[br][br]15 percent of the questions cover topics in geography and the world.
US_HistoryOverView01

How to analyse a Cartoon
Examples of Political Cartoons analyzed.
How to analyze a Cartoon

_Notes on GED Exams

Collect Social Studies Sites

A mathematical approach to GDP
The concept of a nation's GDP is very intriguing, as it is just the sum of expenditures, such that this sum is earned by everyone in the nation.[br][br]It is simply calculated as[br][math]GDP=C+I+G+NX[/math], where C represents Household Consumption, I represents Private Firms' Investment, G represents Government Purchases, and NX stands for Net Exports (which is the difference between exports and imports).[br][br]Yet, I think that this formula for GDP can be 'refined', using the matrix notions.
Introducing Aggregate Expenditure
I argue that GDP is easily calculated as the expenditure of all entities in the economy.[br]If every entity expends, then every entity earns. They earn as much as the sum of revenues from commerce, so we have that:[br][math]AE=\sum\left(price_i\right)\cdot\left(quantity_i\right)[/math], where [i]i[/i] stands for every item traded in the economy. This equation says that Aggregate Expenditure is the sum of the product the price and the quantity of each item.[br]This implies that GDP also has the same form as Aggregate Expenditure.[br][br]Letting price be represented as a row matrix, and quantity as a column matrix, we see their product is the equation given for [i]AE.[/i]
Using Matrices to simplify Multiplication
Aggregate Expenditure is not GDP
Aggregate Expenditure in an economy consists of the trade of imported goods and/or services. But, this expenditure flows out to foreign firms, so it must be deducted from AE.[br][br]We can accomplish this by assuming the expenditure on imported goods and/or services is a fraction of Aggregate Expenditure. So that we'll have that:[br][math]M_i=AE\cdot f_i[/math], for each item [i]i[/i], where M represents imports.[br][br]We also know that local private firms are exporting, and earning revenue in the same form as AE.[br]So, we have that GDP is the sum of Non-Imported Aggregate Expenditure and Exports:[br][math]GDP=\left(1-M\right)AE+X[/math]
What if we don't want to lump all expenditures together?
I understand that the Expenditure formula's purpose for GDP is to distinguish household consumption from expenditures from firms and government. To refine the approach, we can write:[br]
A (3 by n) dimensional AE matrix
Then we could add the net exports matrix.[br][br]This is how to calculate GDP using the matrices notion.
Finding Actual Distances Using an Interactive Map
Use a map scale to determine the distances between U.S. cities in this activity.
Putting It All Together
[i]Answer these open ended questions on your own or with others to form deeper math connections. [/i]
Describe how you can use a scale to find a distance on a map.
Revenue, Cost, Profit: Intro
[url=https://docs.google.com/document/d/1XqeKweiEBz3wdxUvl70TjU_5hPyme-DrB7UPYc5zma0/copy][b][color=#0000ff]Brief Introductory Link (with Questions)[/color][/b][/url]
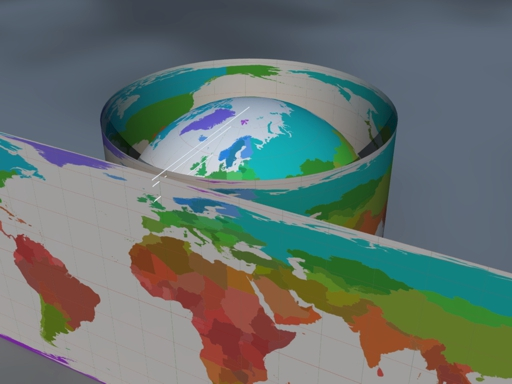
Earth (basic model)
[color=#999999]This activity belongs to the [i]GeoGebra book[/i] [url=https://www.geogebra.org/m/uT3czZnE]Earth and Sun[/url].[/color][br][br][/color]Try wrapping a ball with wrapping paper, and you'll realize that due to its "curvature in all directions," there will always be spaces between the ball and the paper; achieving a perfect fit is impossible.To simplify, let's suppose the shape of the Earth is perfectly spherical. For the most faithful representation of the Earth, it's best to use a globe, because here, just like when wrapping a ball, any attempt to "flatten" the Earth's surface will always result in some kind of distortion, some kind of deviation from the correct measurements (whether distances, angles, or areas).This is because a sphere cannot be "unrolled," meaning its surface cannot be extended onto a plane. The following image corresponds to a world map. We recognize the outlines of the continents, but since it's a flat image rather than a spherical surface, we know it must necessarily be distorted. All world flat maps, in some way, "lie".

In this case, the spherical surface has been "painted" as if the Earth were a cylinder rolling on the paper (this method of projection is called cylindrical projection and, when applied to the Earth, is known as the Mercator projection). Notice that the Arctic (with its ice mass represented as a solid) and Antarctica appear extremely exaggerated, as both the North Pole and the South Pole stretch across the entire length of the image, instead of being represented as points.
For these reasons, it is advisable to have a globe template rather than relying on a world map, as shown in the following construction.[br][br][color=#999999]For better execution, it's recommended to download de GGB file.[/color]
[color=#999999]Author of the construction of GeoGebra: [color=#999999][url=https://www.geogebra.org/u/rafael]Rafael Losada[/url][/color][/color]
Mean, Median, Mode, and Range
[b][u]Data Analysis[/u][/b] means being able to find the following measures of central tendency: [b]mean[/b], [b]median[/b], [b]mode[/b], and [b]range[/b]. The mode is written as a list of elements separated by a comma. When there is [b][u]no mode[/u][/b], click on the [b]No Mode[/b] check box below the mode value entry.[br][br]Many call the [b]mean[/b], the [i][u]average[/u][/i]. But there is more than just one value used to persuade people to their side; these are the [b]mode[/b], [b]median[/b], and [b]range[/b].
Definitions
[b]mean:[/b] add all values is set and divide by the number of values[br][b]median:[/b] the number in the middle of the sort list of values; when there is an even number the median is the average of the two middle numbers[br][b]mode:[/b] the most common value in the set; sometimes there is no value or multiple different common values {[b]M[/b]ost [b]O[/b]ften [b]D[/b]ata [b]E[/b]ntered}; Mode answers must be inside of { } for None, {#} for a single mode, {#,#,...} for multiple mode answers.[br][b]range:[/b] the difference of the largest and smallest values
Beginner's Guide to Statistics and Probability Distribution