
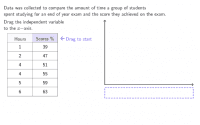
Reveal how to create a scatter plot by identifying dependent and independent variables, and then plotting data points from a table.
Apenas os utilizadores que receberam o Ligação podem ver este material. Não aparecem nos resultados de pesquisa de outros utilizadores.